
Binary Hardening in IoT products
Last year, the team at CITL looked into the state of binary hardening features in IoT firmware.
Since then we’ve added more vendors and refreshed our analytic techniques. This post will catch you up on the latest findings and developments.
Background
We built a corpus by collecting firmware updates published by vendors on their websites. To analyze this corpus, we wrote a pipeline to extract any Linux root filesystems we could find in the images. Filesystems in hand, the pipeline then fed every binary it could find into our analytic toolset.
You may have seen us present our initial findings on this corpus at HushCon (Seattle 2018) or ShmooCon 2019 (video link). This post updates and expands those findings.
Key Findings
CITL identified a number of important takeaways from this study:
- On average, updates were more likely to remove hardening features than add them.
- Within our 15 year data set, there have been no positive trends from any one vendor.
- MIPS is both the most common CPU architecture and least hardened on average.
- There are a large number of duplicate binaries across multiple vendors, indicating a common build system or toolchain.
Data Collected
- 22 Vendors
- 1,294 Products
- 4,956 Firmware versions
- 3,333,411 Binaries analyzed
- Date range of data: 2003-03-24 to 2019-01-24 (varies by vendor, most up to 2018 releases)
Note: Not all firmware images were able to be tagged with a release date so any time-series or time based analysis we show will be a subset of the total data.
IoT landscape
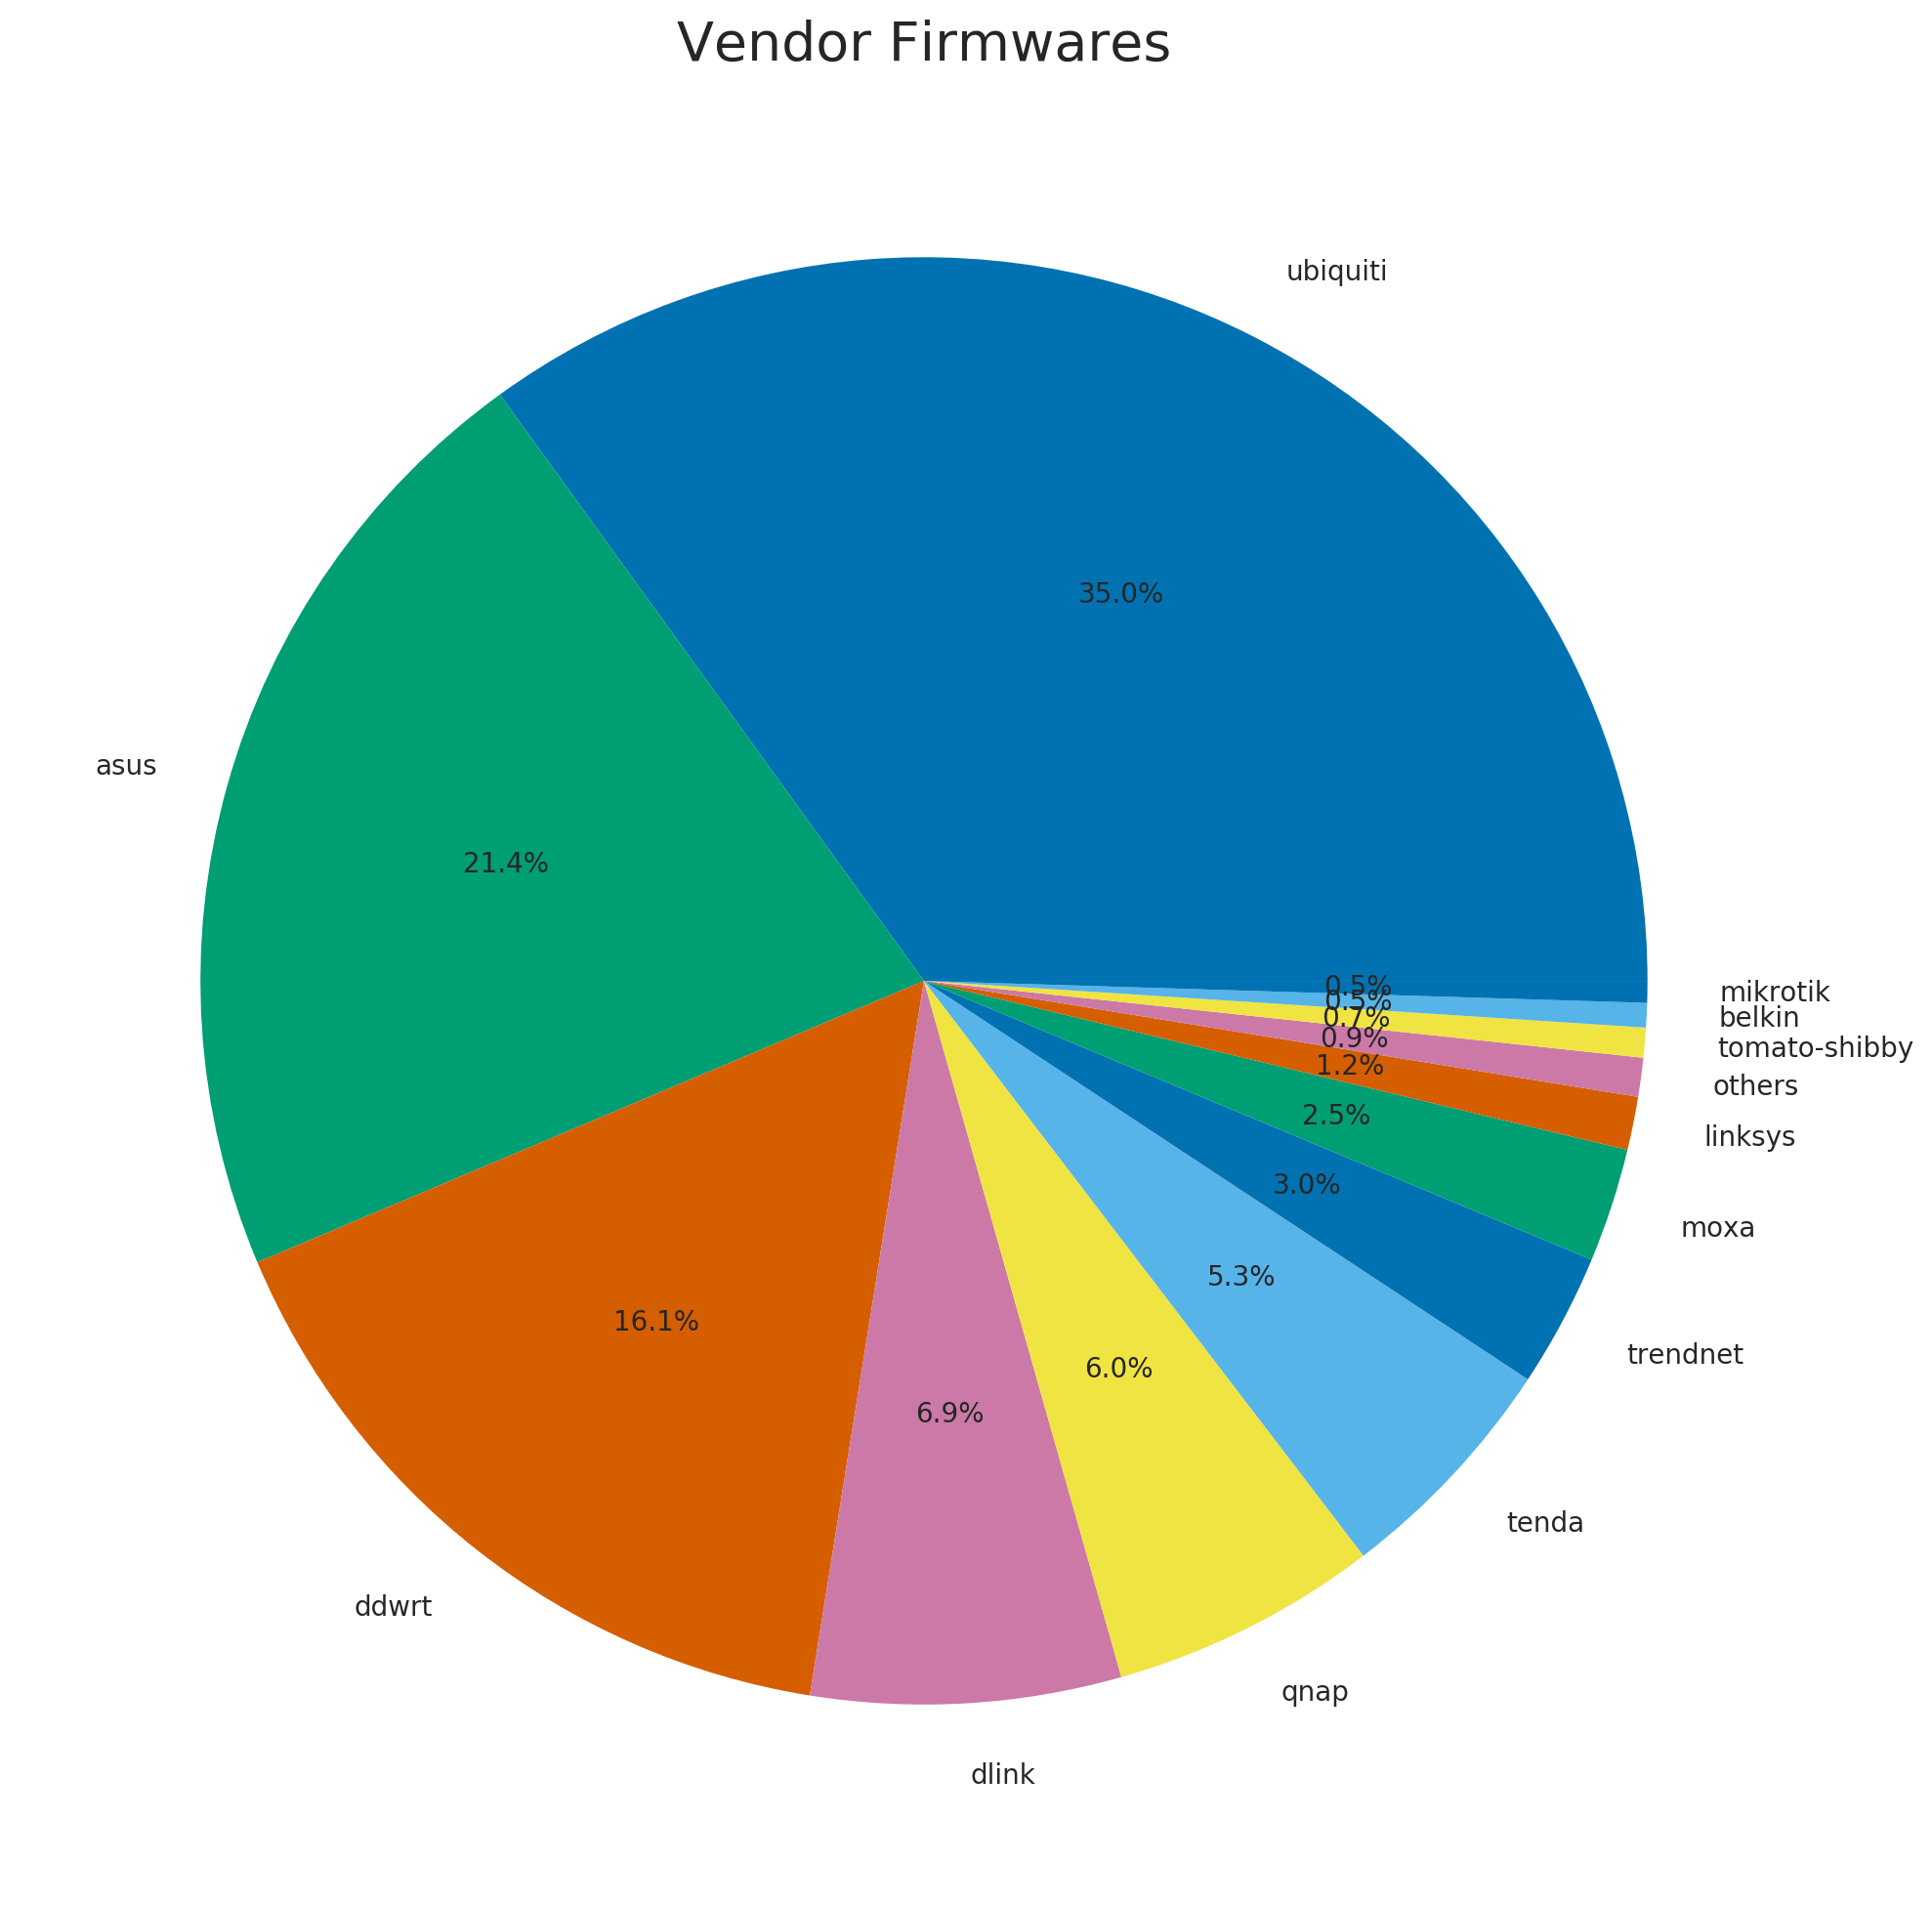
Vendor Distribution
In our corpus, Ubiquiti and Asus had the largest number of firmware releases followed by DD-WRT and D-link.
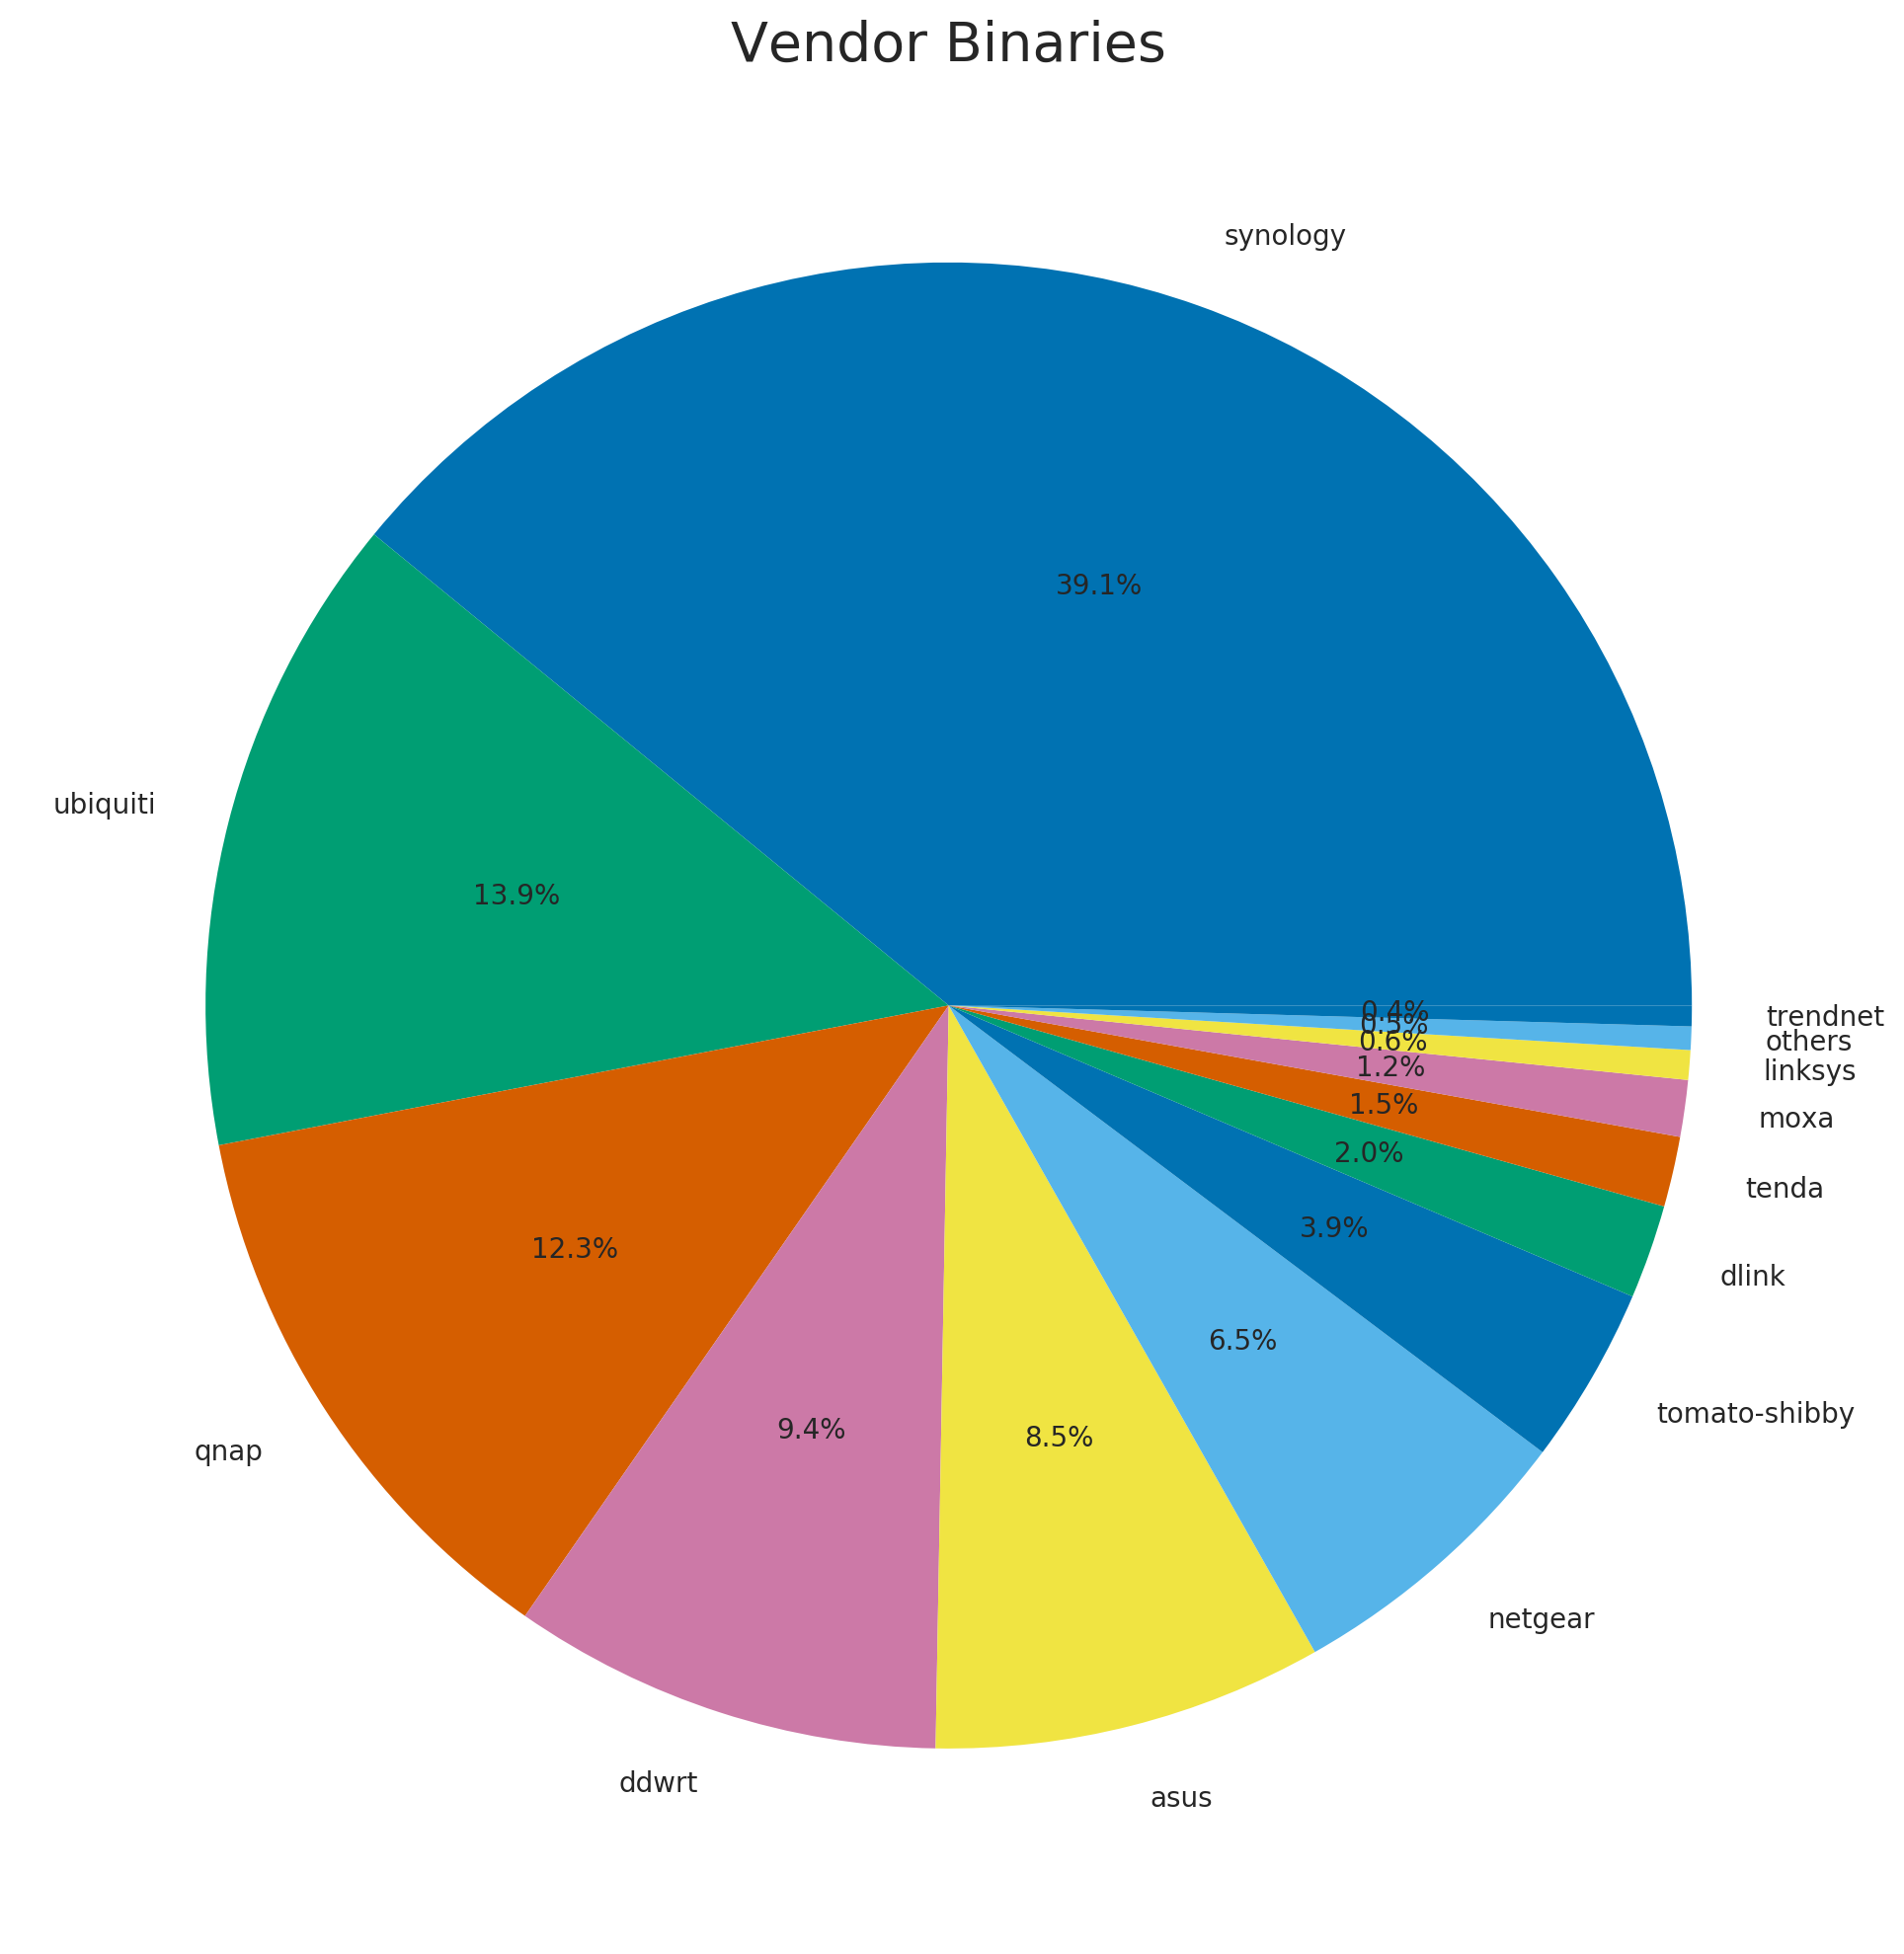
Vendor binary counts were slightly different, with Synology holding the largest share of binaries in the corpus.
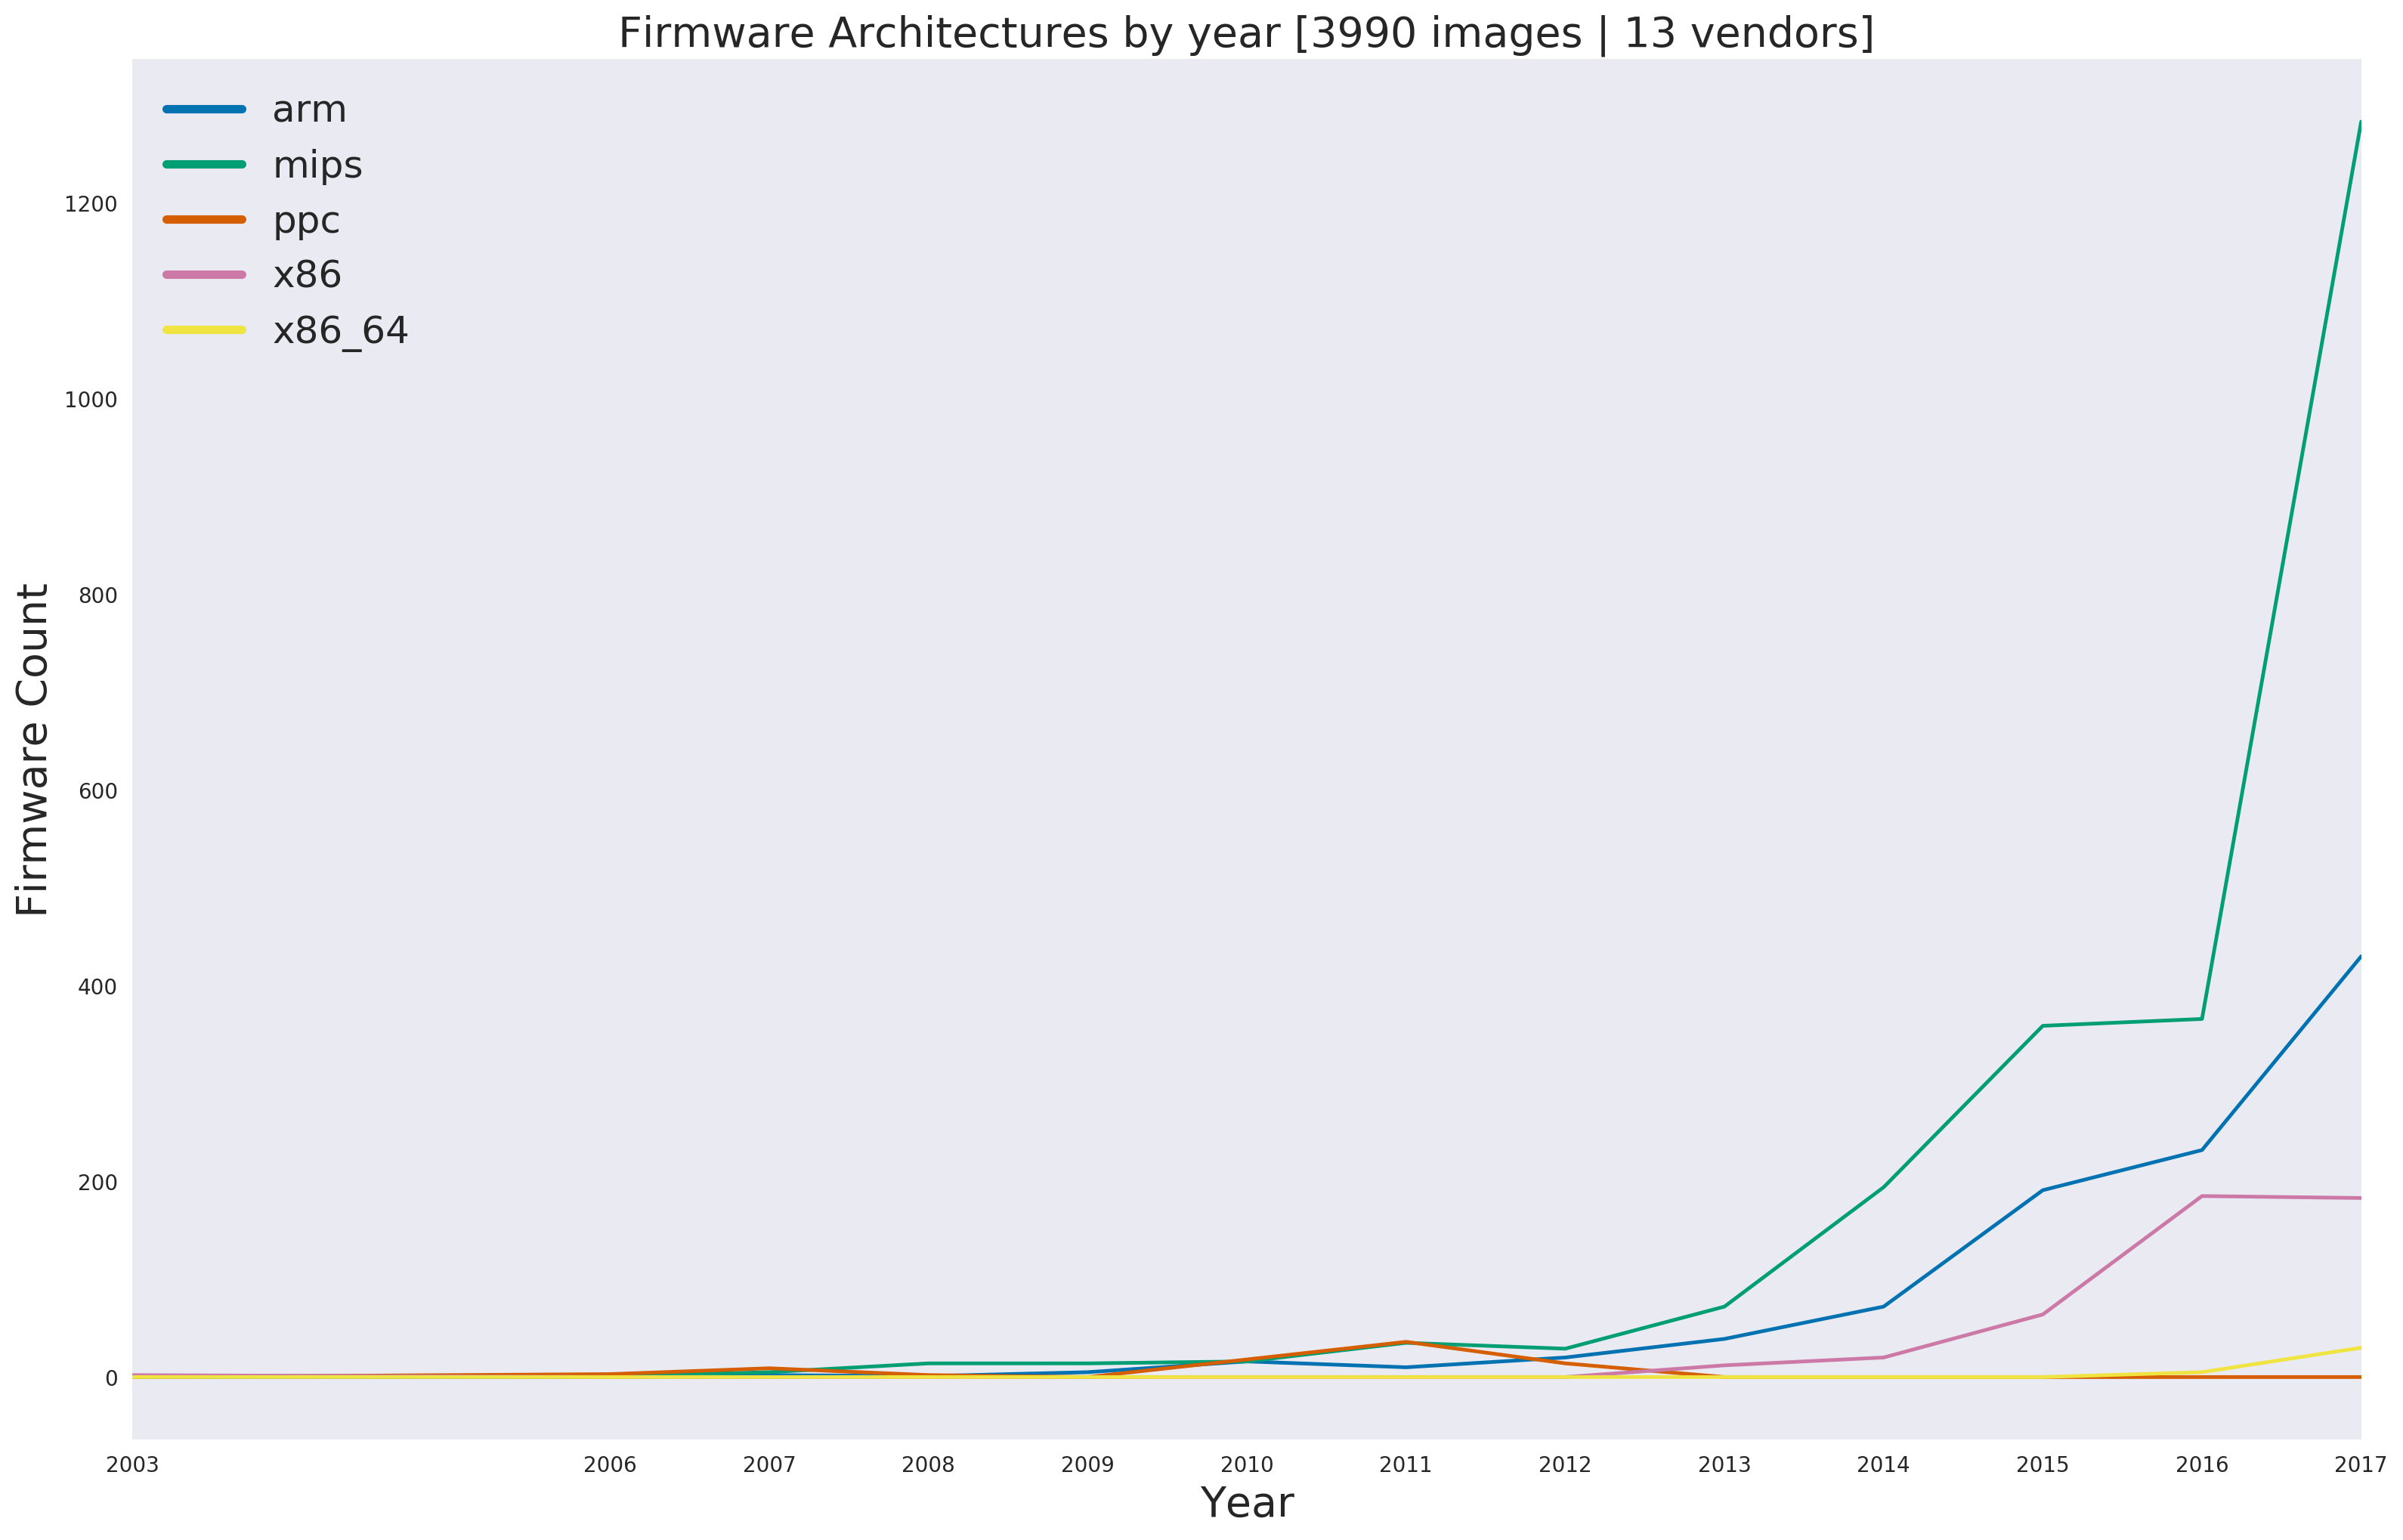
CPU Architecture
Surprisingly, for all the talk about ARM, MIPS is still an extremely popular architecture. At least within our corpus, MIPS beats out ARM even well into 2018 as being the most common CPU architecture.
CPU Architecture and CITL Score
At CITL we use a aggregate score to normalize all the different hardening features a binary can have. This score is on a 0 - 100 range and can be thought of as ‘out of all possible features how many did a binary enable?’. It also takes into account the prevalence of riskier functions like system(), strcpy() and other common poor hygiene indicator functions. A higher score means the binary has more hardening features enabled and thus higher scores are better.
Here we compare CPU architecture prevalence with their average (mean) score.
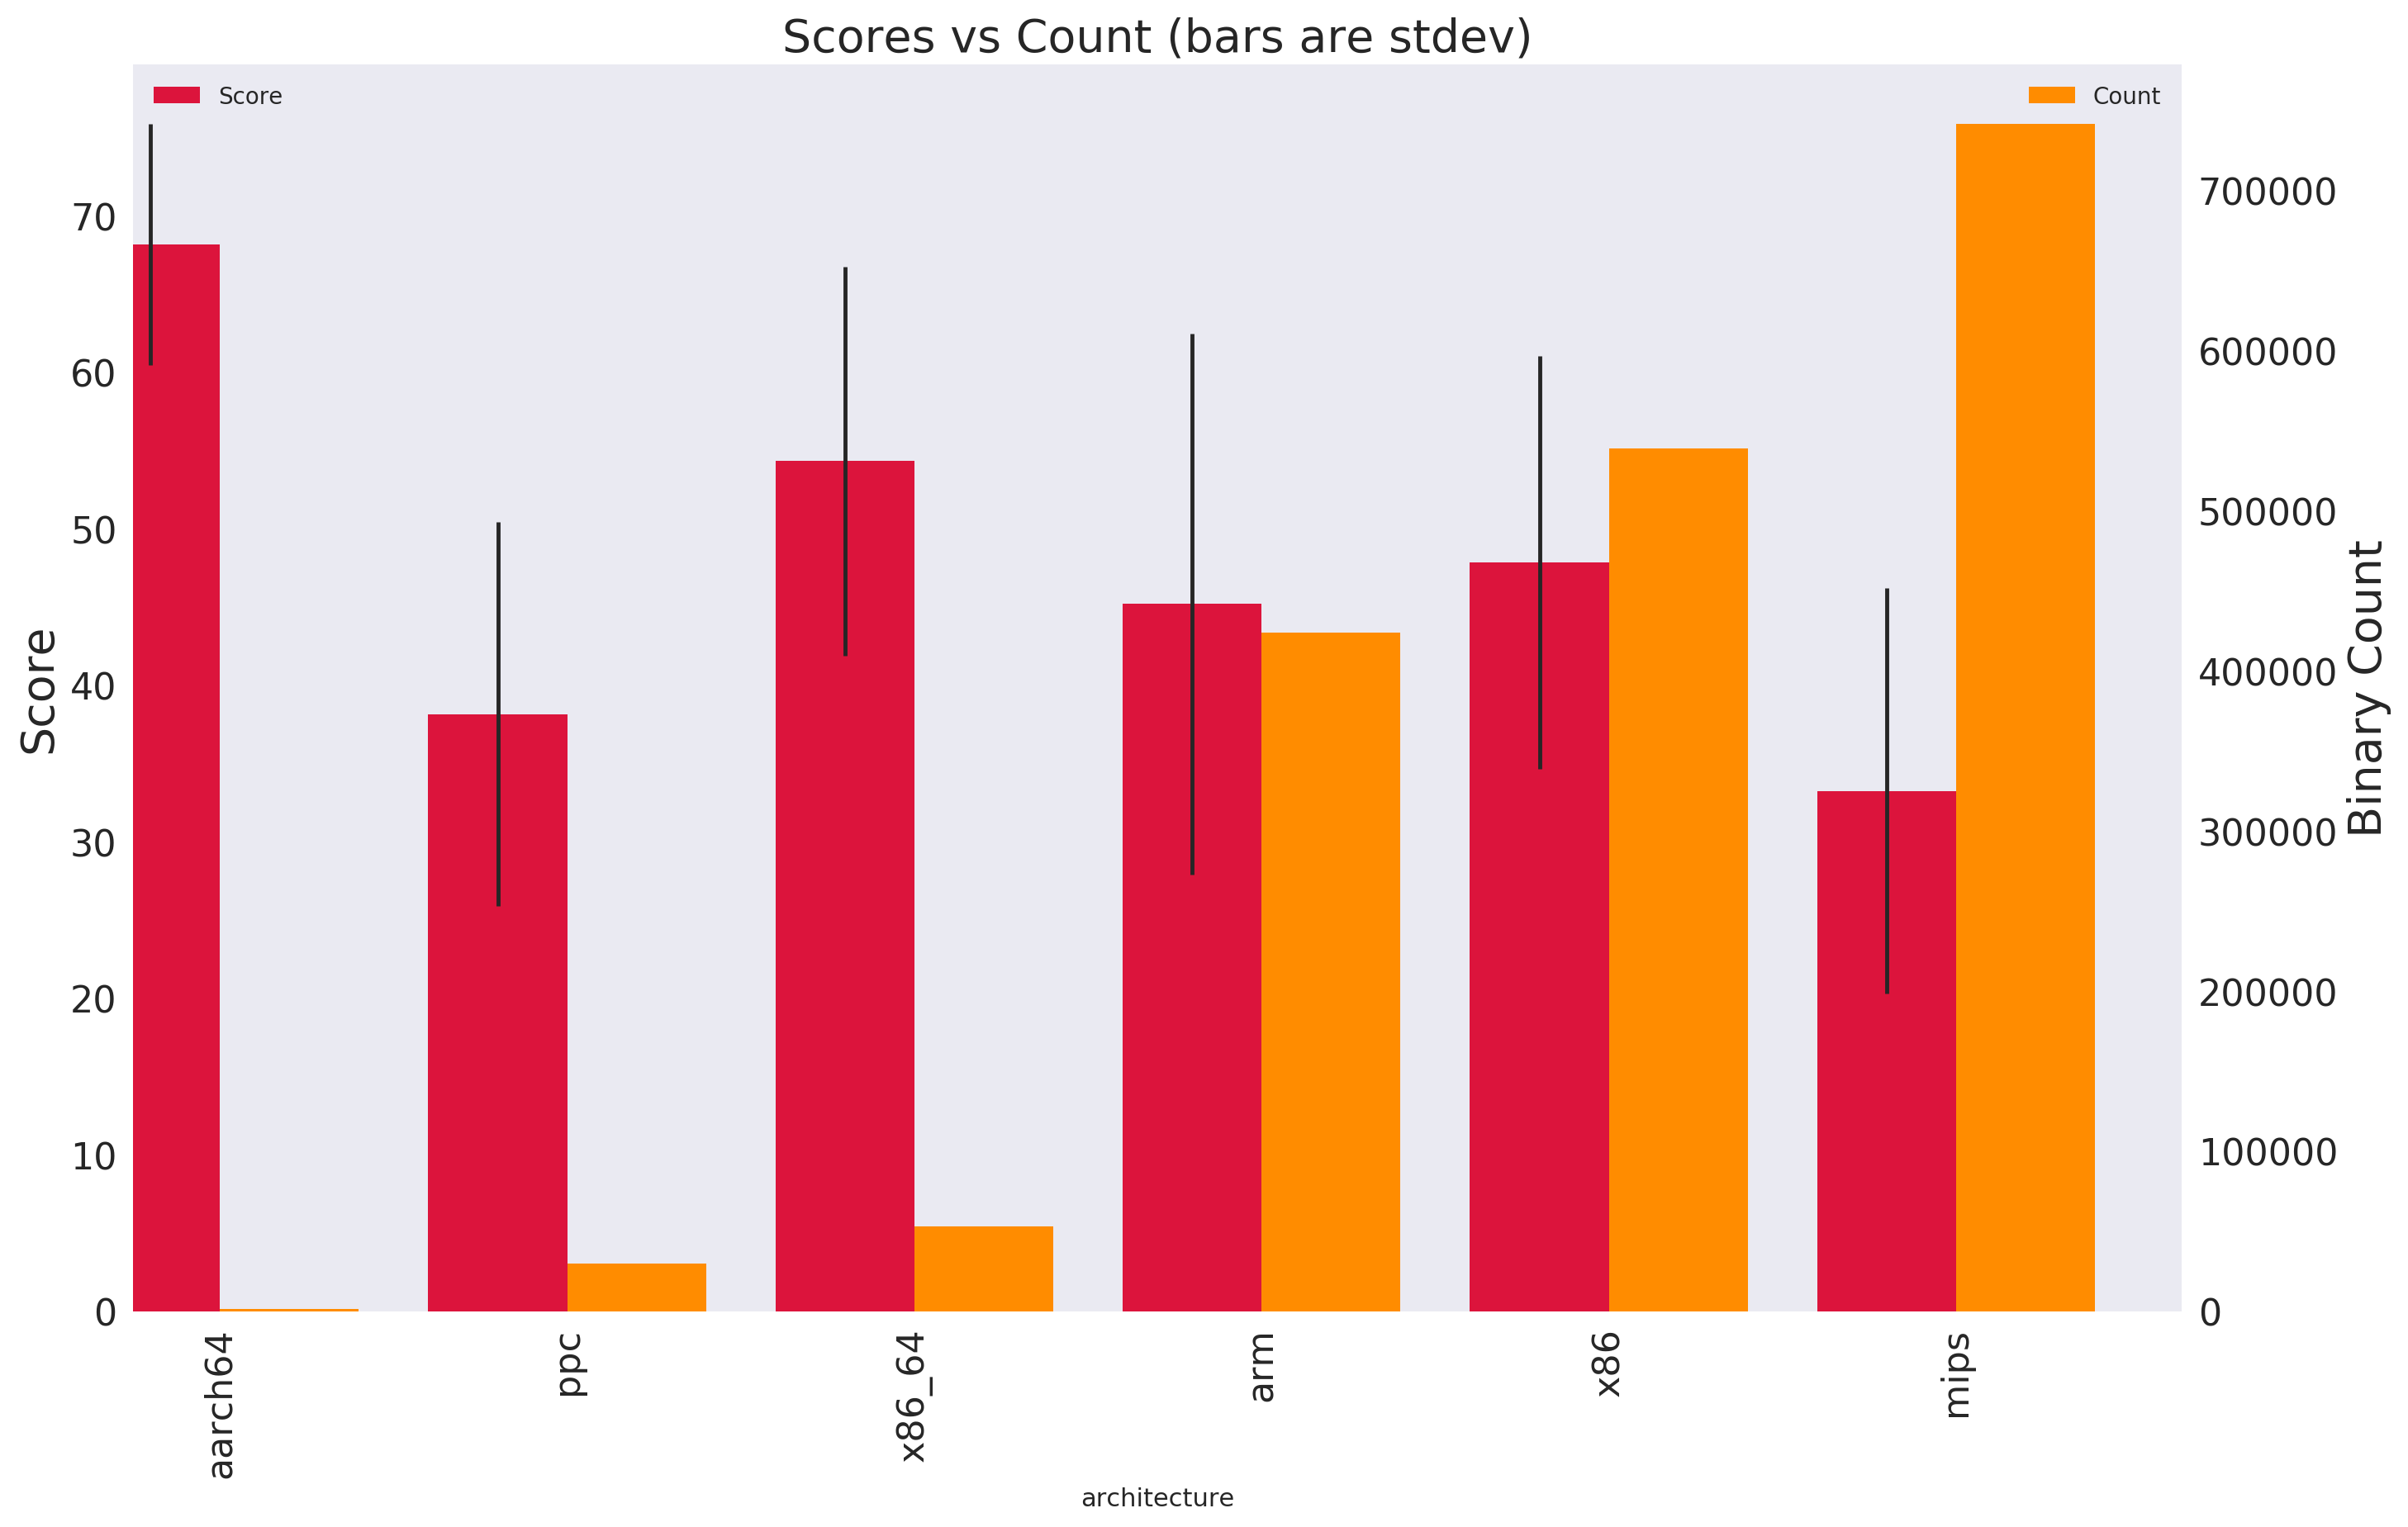
In this chart we can see the number of binaries in orange with the average score in red. On the far left we see aarch64 (arm64) being the highest average scoring, but least common. At third from the left is mips with the highest binary count and lowest average score.
Measuring Changes
Vendor Summaries 2012 vs 2018
To better understand how vendors have evolved their practices over time, we selected two years (2012 and 2018) that both saw a large number of releases by different vendors. How do the big-picture numbers vary between these two years?
Let’s compare. The following tables shows the degree to which different vendors applied different build-hardening features in the given years. Each row represents a different vendor, with each column indicating the percentage of binaries shipped by that vendor with the given feature.
2012
| Vendor | non-exec Stack | ASLR | Stack Guards | Fortify | RELRO | Count |
|---|---|---|---|---|---|---|
| asus | 0.56 | 0.00 | 0.0 | 0.00 | 3.36 | 4 |
| belkin | 0.00 | 1.36 | 0.0 | 0.00 | 0.76 | 3 |
| dlink | 56.37 | 0.10 | 0.0 | 2.83 | 28.82 | 32 |
| linksys | 0.00 | 2.71 | 0.0 | 0.00 | 0.90 | 4 |
| moxa | 16.55 | 0.00 | 0.0 | 0.64 | 10.75 | 6 |
| tenda | 0.00 | 0.00 | 0.0 | 0.00 | 4.64 | 12 |
| trendnet | 0.00 | 0.00 | 0.0 | 0.00 | 0.00 | 1 |
| ubiquiti | 0.00 | 4.05 | 0.0 | 1.87 | 25.34 | 1 |
2018
| Vendor | non-exec Stack | ASLR | Stack Guards | Fortify | RELRO | Count |
|---|---|---|---|---|---|---|
| asus | 49.70 | 1.76 | 2.40 | 0.08 | 2.96 | 234 |
| belkin | 0.00 | 0.75 | 0.00 | 0.00 | 1.76 | 3 |
| buffalo | 65.56 | 0.00 | 2.20 | 0.00 | 65.08 | 3 |
| ddwrt | 98.94 | 1.17 | 3.04 | 0.00 | 58.10 | 208 |
| dlink | 42.84 | 0.65 | 0.08 | 0.86 | 7.42 | 14 |
| linksys | 39.98 | 1.53 | 16.22 | 0.00 | 22.05 | 10 |
| mikrotik | 45.76 | 0.00 | 0.00 | 0.00 | 2.88 | 24 |
| moxa | 78.12 | 11.98 | 9.86 | 6.64 | 19.43 | 57 |
| openwrt | 99.59 | 0.00 | 32.00 | 0.00 | 98.72 | 14 |
| phicomm | 59.62 | 3.58 | 0.00 | 0.00 | 11.44 | 5 |
| qnap | 99.59 | 7.48 | 68.29 | 1.23 | 1.56 | 22 |
| tenda | 24.95 | 0.60 | 0.95 | 0.00 | 7.13 | 16 |
| tp-link | 16.52 | 0.00 | 0.86 | 0.05 | 6.19 | 12 |
| trendnet | 30.61 | 8.70 | 18.09 | 0.39 | 27.81 | 23 |
| ubiquiti | 24.74 | 0.34 | 1.68 | 5.88 | 20.30 | 298 |
Changes Between 2012 and 2018
The following table summarizes the changes from 2012 to 2018. Looking at the changes between the two years a few things stand out:
- DLINK lost most hardening coverage from 2012 to 2018
- While most changes from 2012 to 2018 are positive, the amount of change tends to be small.
non-exec Stackwas the only feature that showed notably-increased adoption.
Change Between 2012 - 2018 by Vendor
| Vendor | non-exec Stack | ASLR | Stack Guards | Fortify | RELRO | Count |
|---|---|---|---|---|---|---|
| asus | 49.14 | 1.76 | 2.40 | 0.08 | -0.40 | 230.0 |
| belkin | 0.00 | -0.61 | 0.00 | 0.00 | 1.00 | 0.0 |
| dlink | -13.53 | 0.55 | 0.08 | -1.97 | -21.40 | -18.0 |
| linksys | 39.98 | -1.18 | 16.22 | 0.00 | 21.15 | 6.0 |
| moxa | 61.57 | 11.98 | 9.86 | 6.00 | 8.68 | 51.0 |
| tenda | 24.95 | 0.60 | 0.95 | 0.00 | 2.49 | 4.0 |
| trendnet | 30.61 | 8.70 | 18.09 | 0.39 | 27.81 | 22.0 |
| ubiquiti | 24.74 | -3.71 | 1.68 | 4.01 | -5.04 | 297.0 |
Do Update Improve Hardening Coverage?
We were very interested in measuring how updating a single product can effect the coverage of hardening features.
In order to do this, we took the difference in hardening coverage between the first release and the last release of a firmware and compare their changes. A histogram of the deltas can be seen below. As can be seen, for most products the change in score was approximately 0.
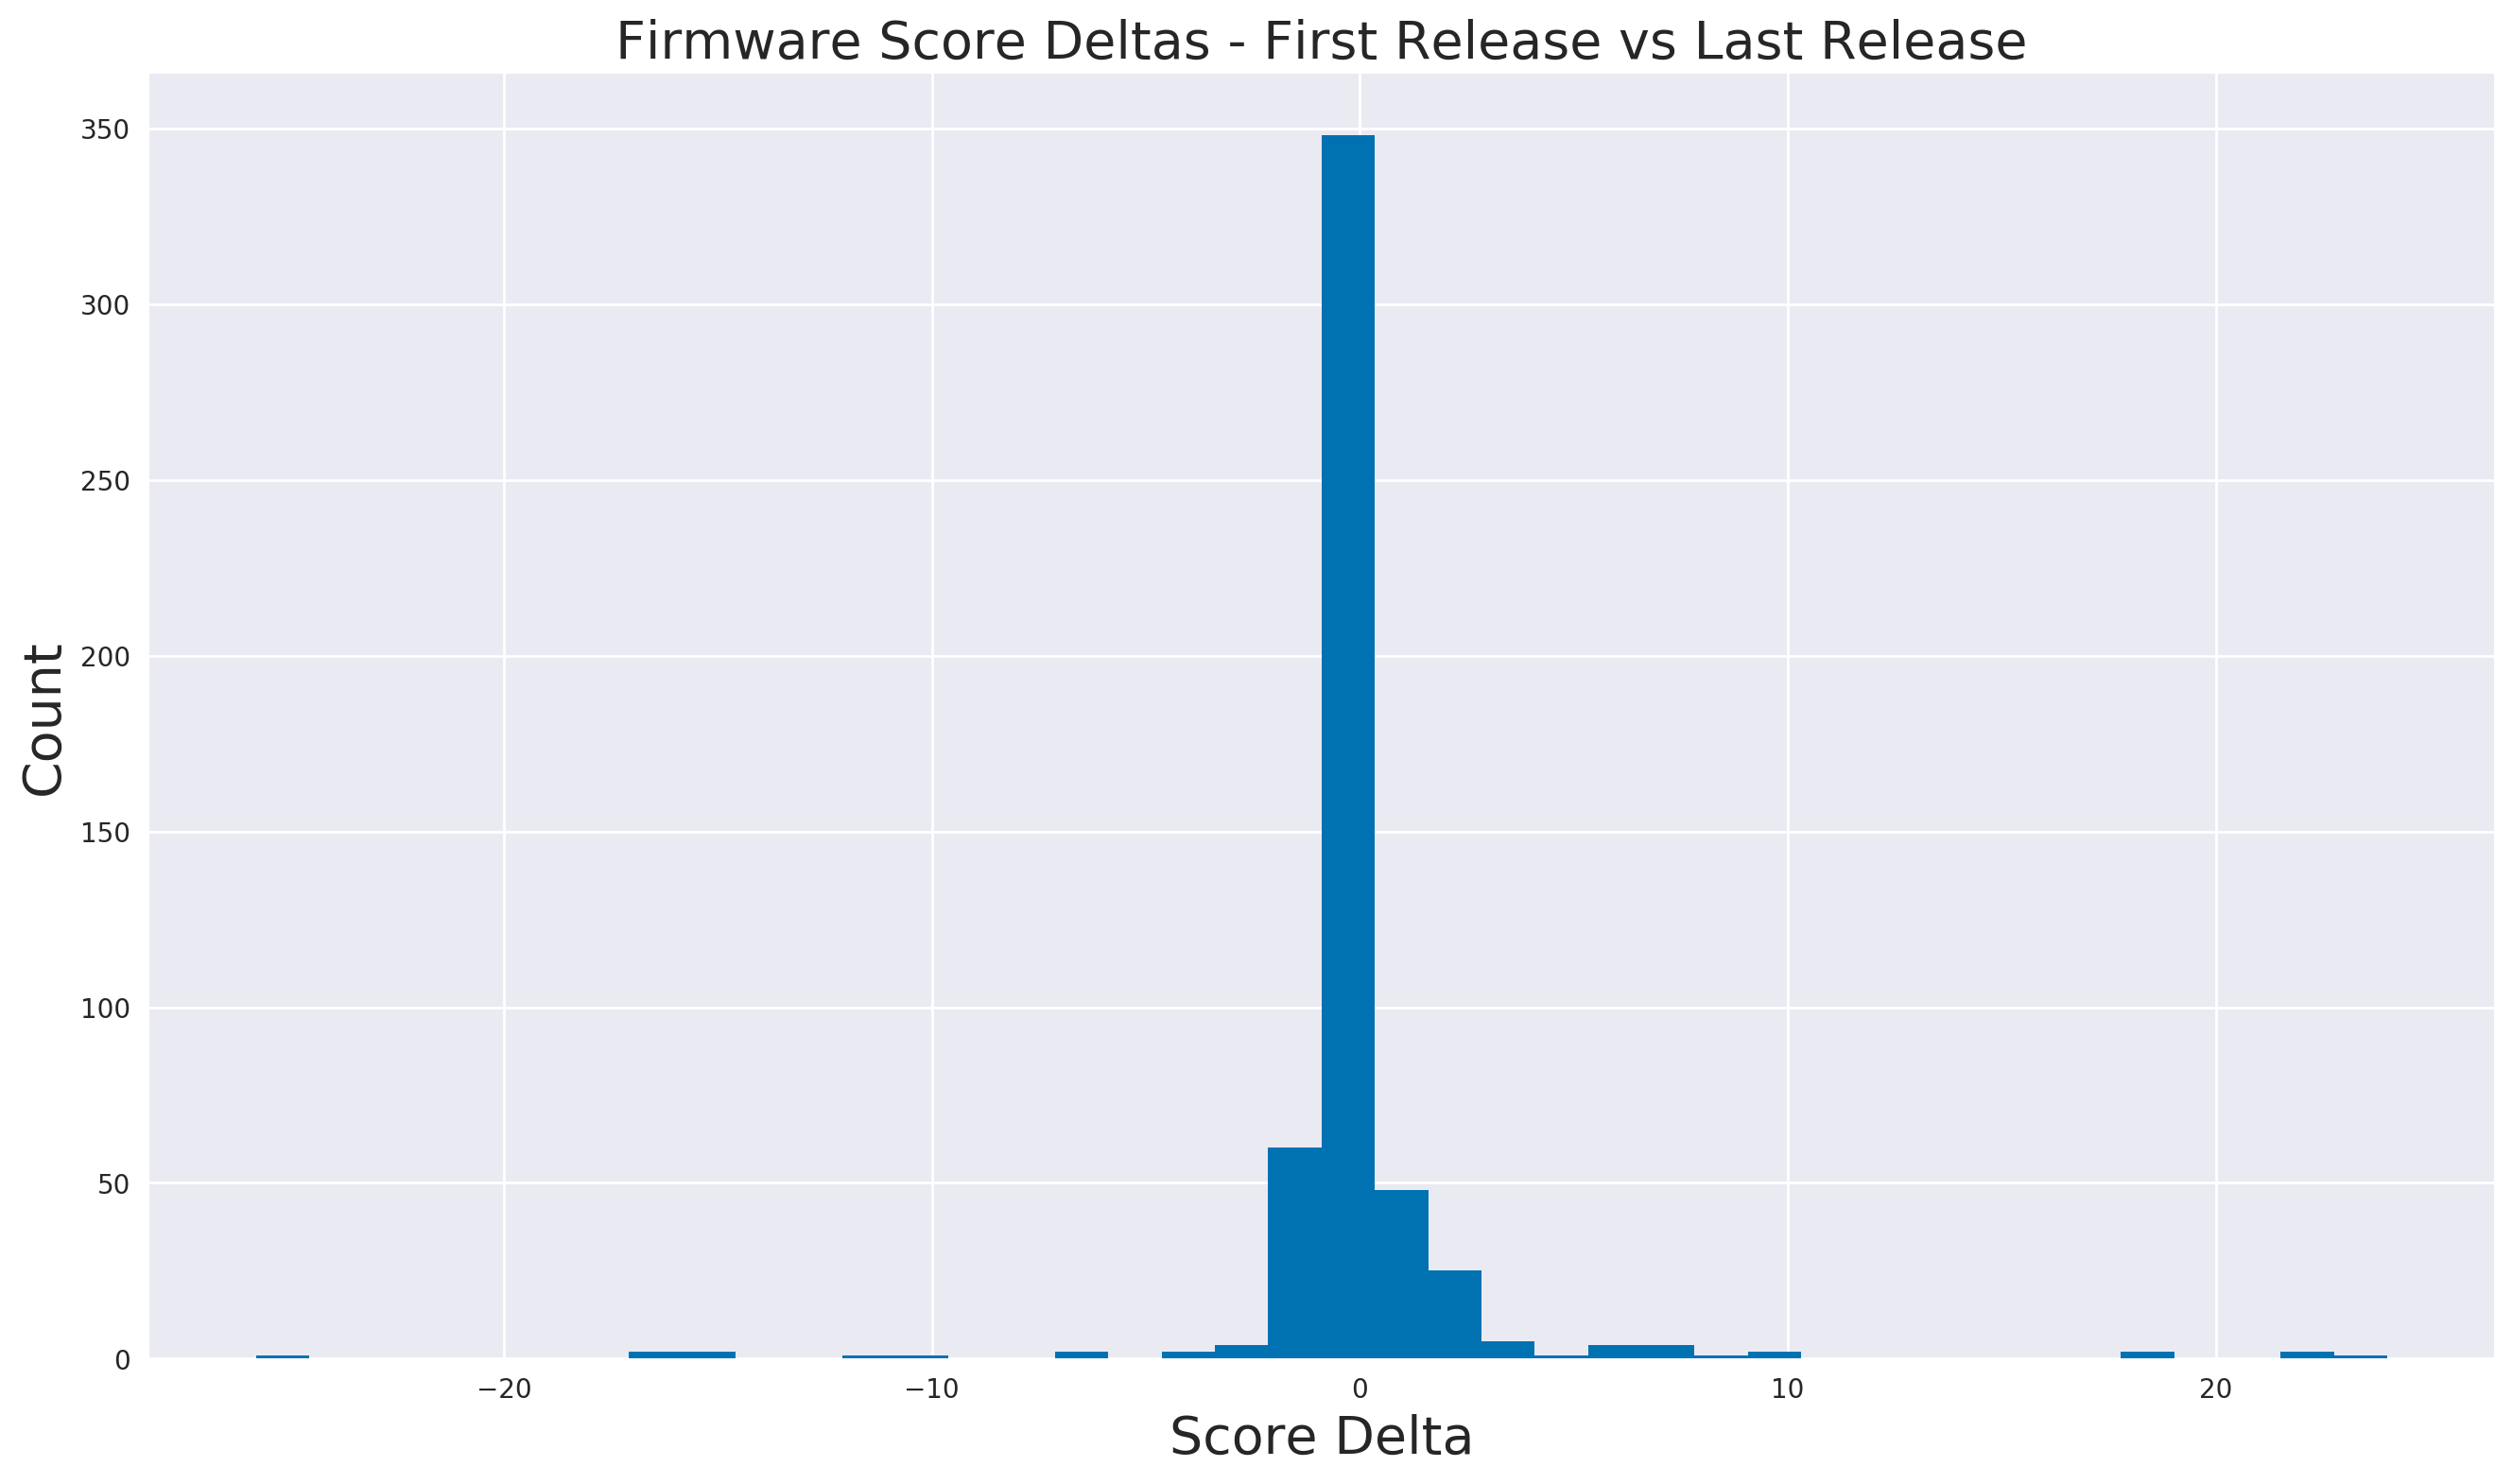
Now consider the histogram’s tails (the regions to the left- and right- of 0). Comparing just the positive changes and negative changes, we found that is was more common for updates to reduce overall hardening than increase it.
| Positive Score Change | Negative Score Change |
|---|---|
| 156 | 282 |
Insecure Updates Case Study: Ubiquiti
Ubiquiti has the dubious distinction of shipping one of the most regressive update in our corpus, affecting the Ubiquiti UAP-HD family of products.
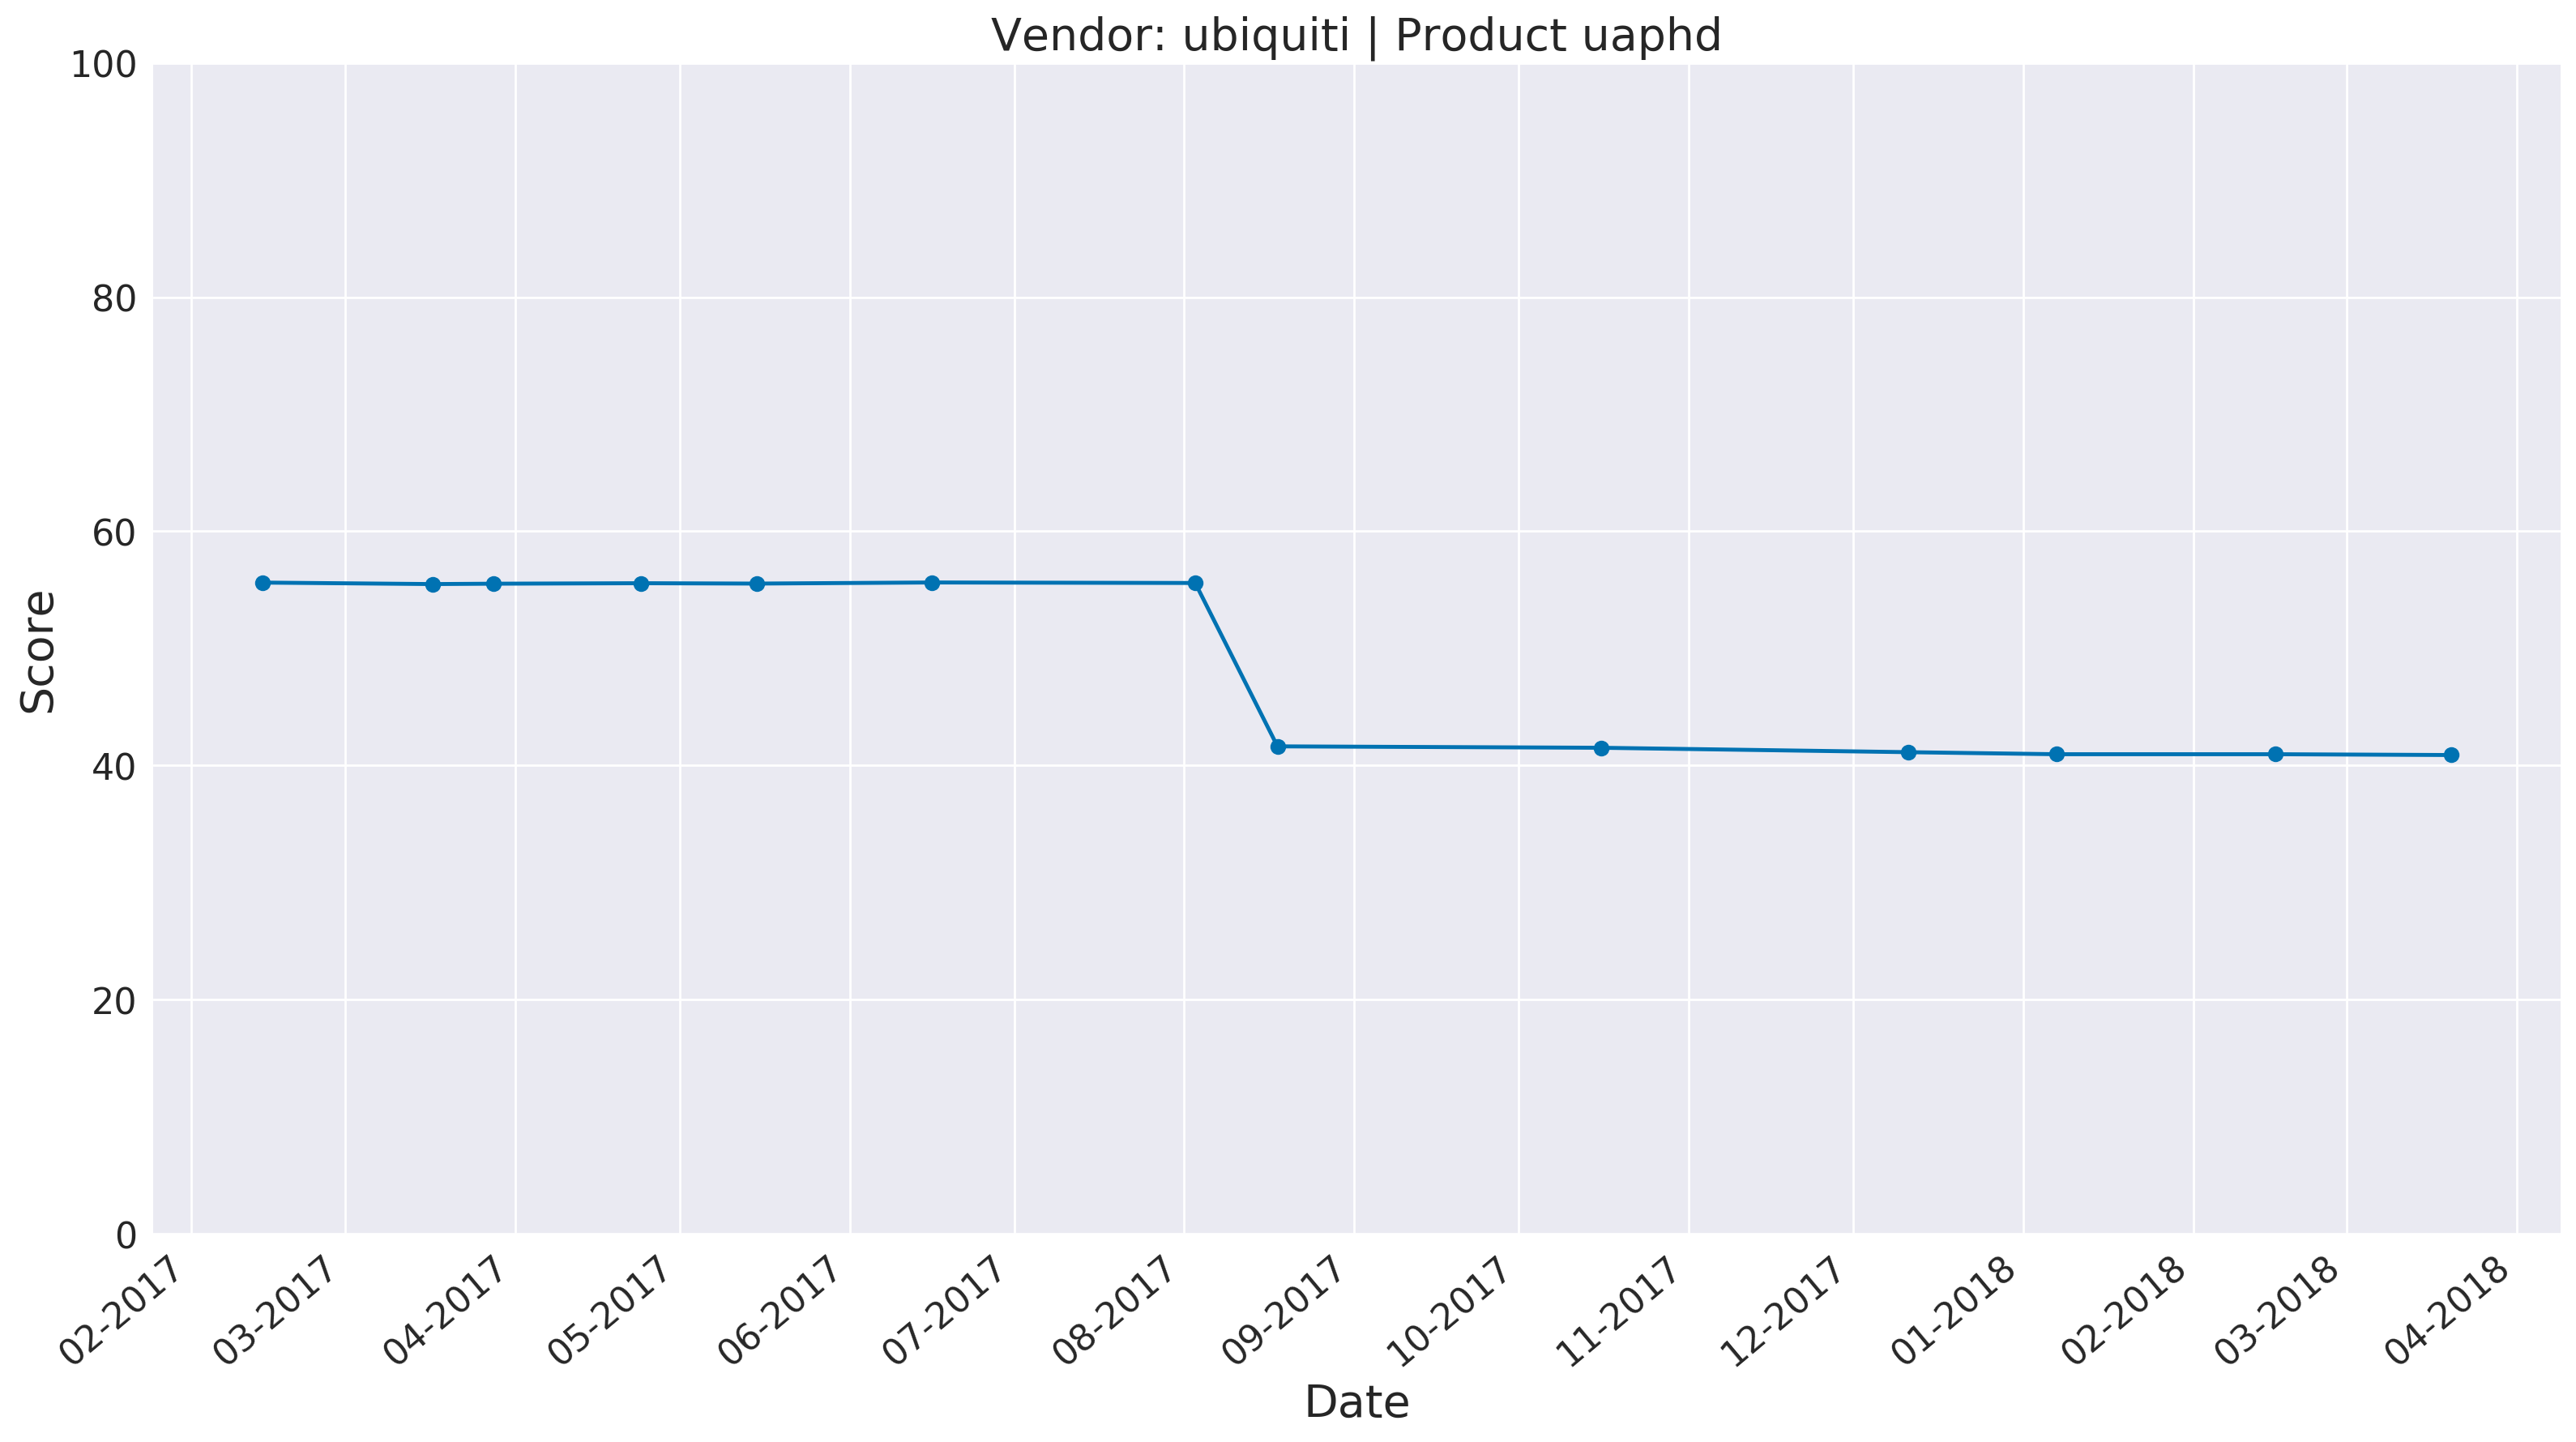
The update released in September of 2017 drastically reduced the overall score of the UAP-HD product line.
In order to narrow down on the root cause, we split the data apart and plotted the various hardening features side-by-side. The following chart depicts, for each firmware release, the percentage of binaries defended by various hardening features, together with the length of time that release was ‘current’.

Using this chart we can see that, towards the end of summer 2017, relro dropped from ~80% coverage to below 10%, stack_guards dropped from ~70% to nearly zero, and aslr was completely removed.
At the time of publishing, we do not have data for 2019 builds available. However, the observed trend of removing hardening features shows that Ubiquiti most likely did not have any form of regression testing to validate their builds for binary hardening prior to release.
All Ubiquiti Product’s Scores Over Time
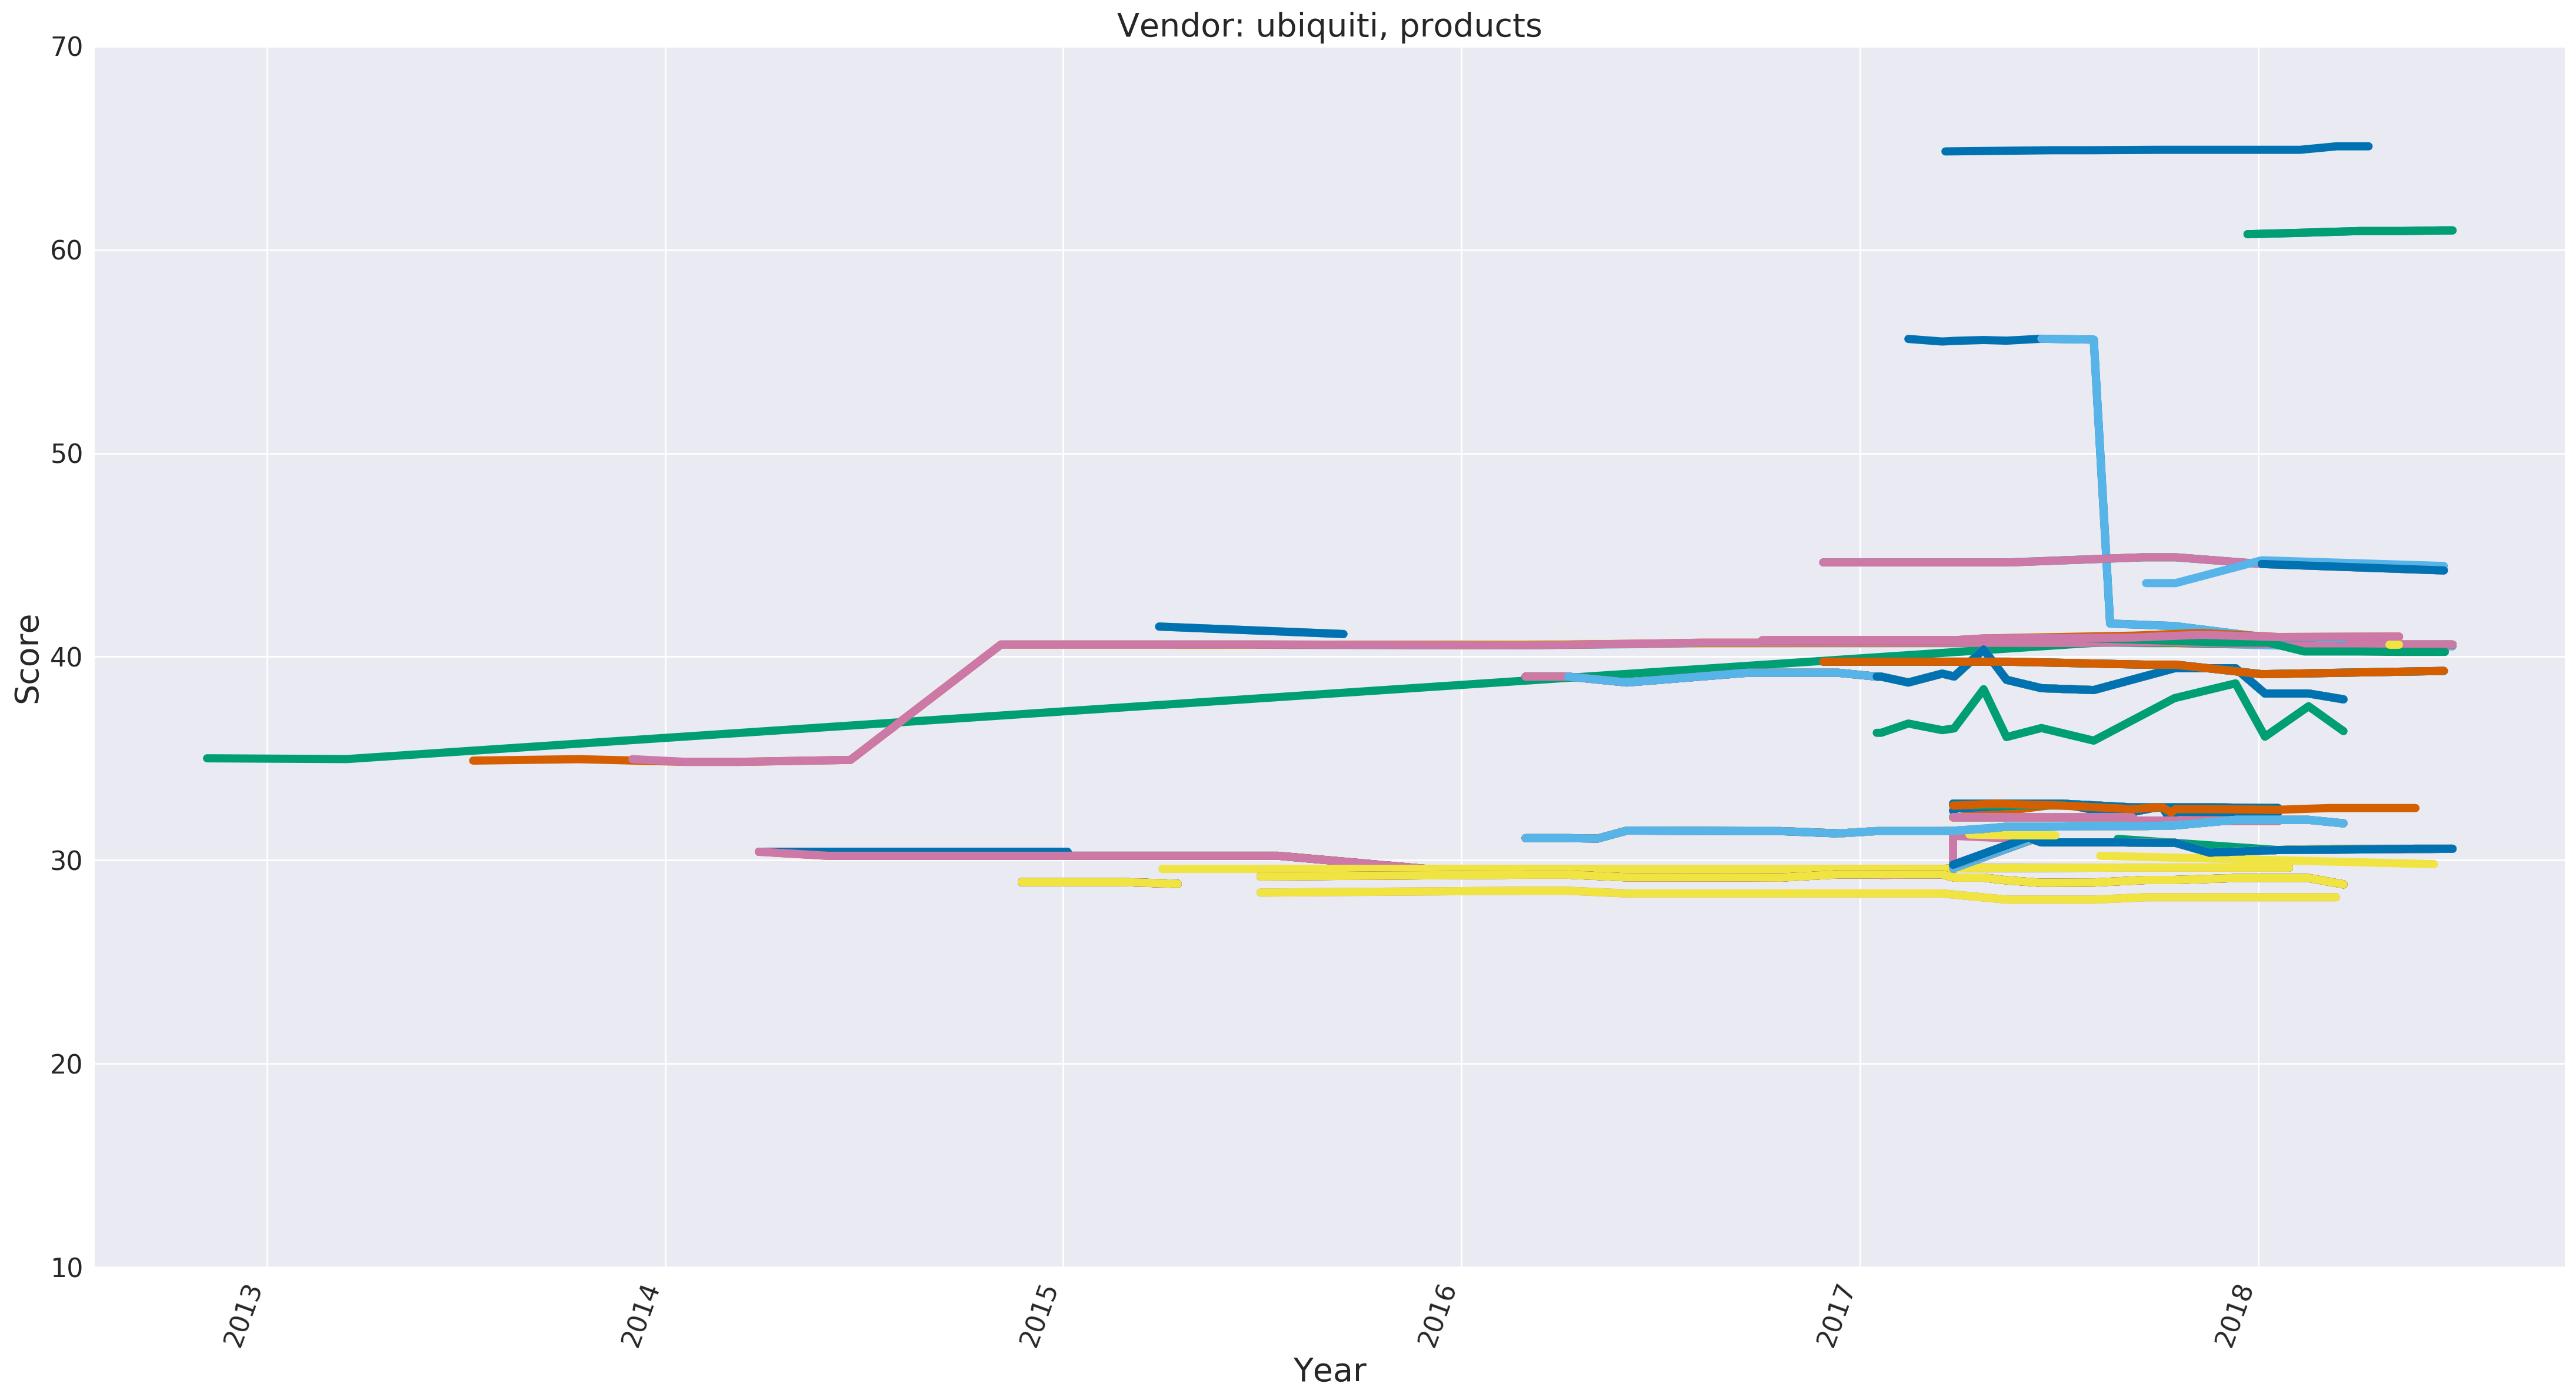
When looking at a time series of all Ubiquiti products we can see a few interesting trends.
- The UAP-HD stands out as an extreme example of regressive updates.
- Most products don’t change their score over their life cycle.
- There is a large range of scores, indicating a lack of centralized build/testing for harding features.
- In 2018 Ubiquiti released both one of the most hardened products and least hardened products, which shows that their security practices are becoming more divergent over time.
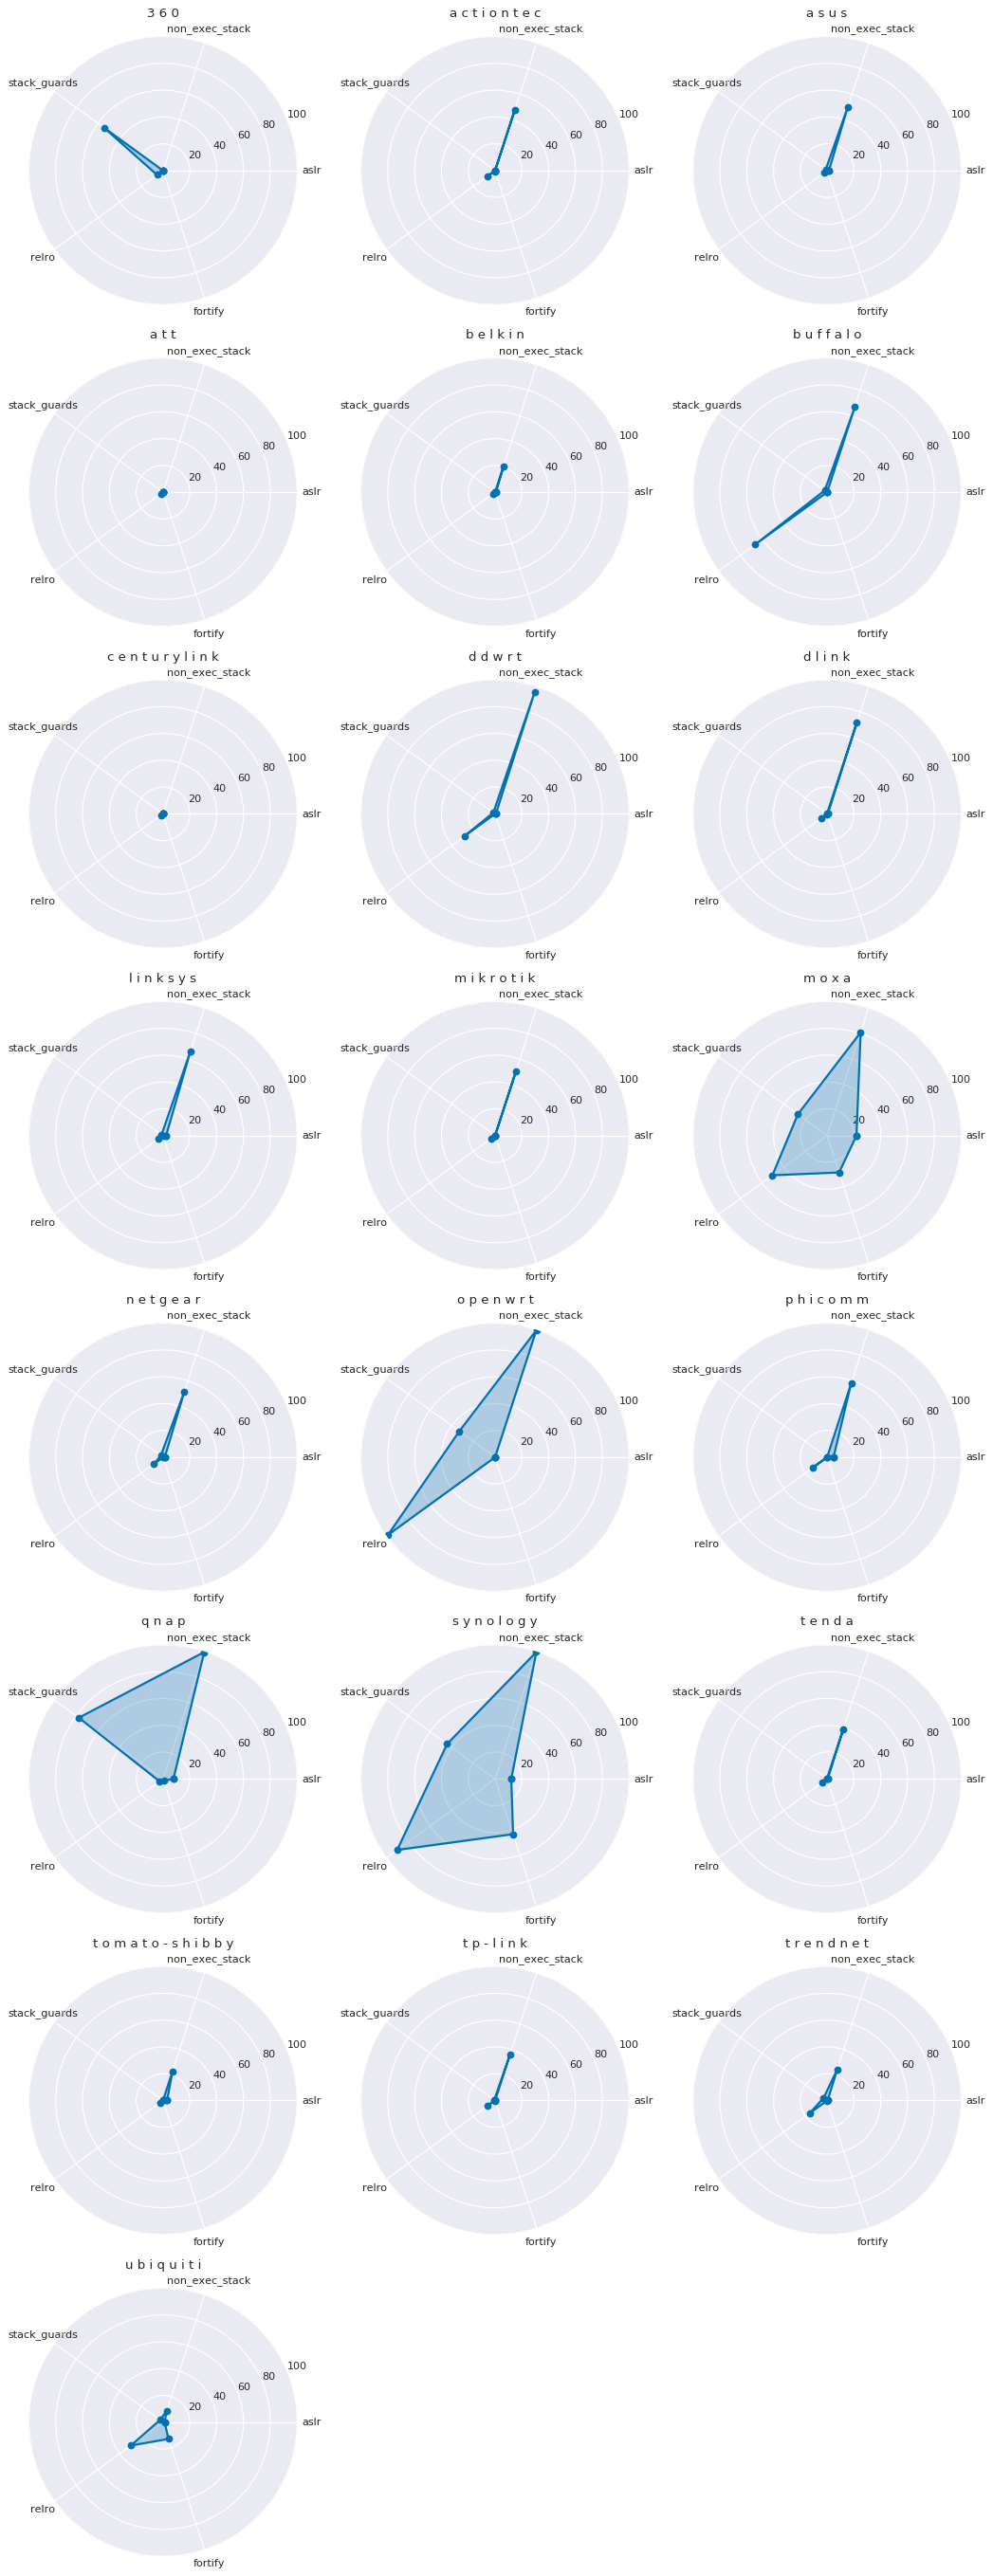
Vendor Radar Charts
Below is a complete list of average (mean) hardening coverage, grouped by vendor. CITL uses radar charts to visualize this because it give a very clear coverage map: the more area covered, the better the binary hardening (on average).
Unfortunately, with few exceptions (notably Synology) we see there is very little coverage, and even Synology struggles to adopt basic hardening features like ASLR and stack guards.
A perfect score, where all binaries had all 5 basic safety features, would result in a chart that looks like a regular pentagon. Instead, in most vendors’ cases, they struggle to achieve polygon status at all.
Duplicate Binaries
With the large number of binaries for different vendor firmwares CITL was interested in how common duplicate binaries were between different vendors. We measured this by looking at how often the SHA-256 hash of a binary was found in 2 or more vendors.
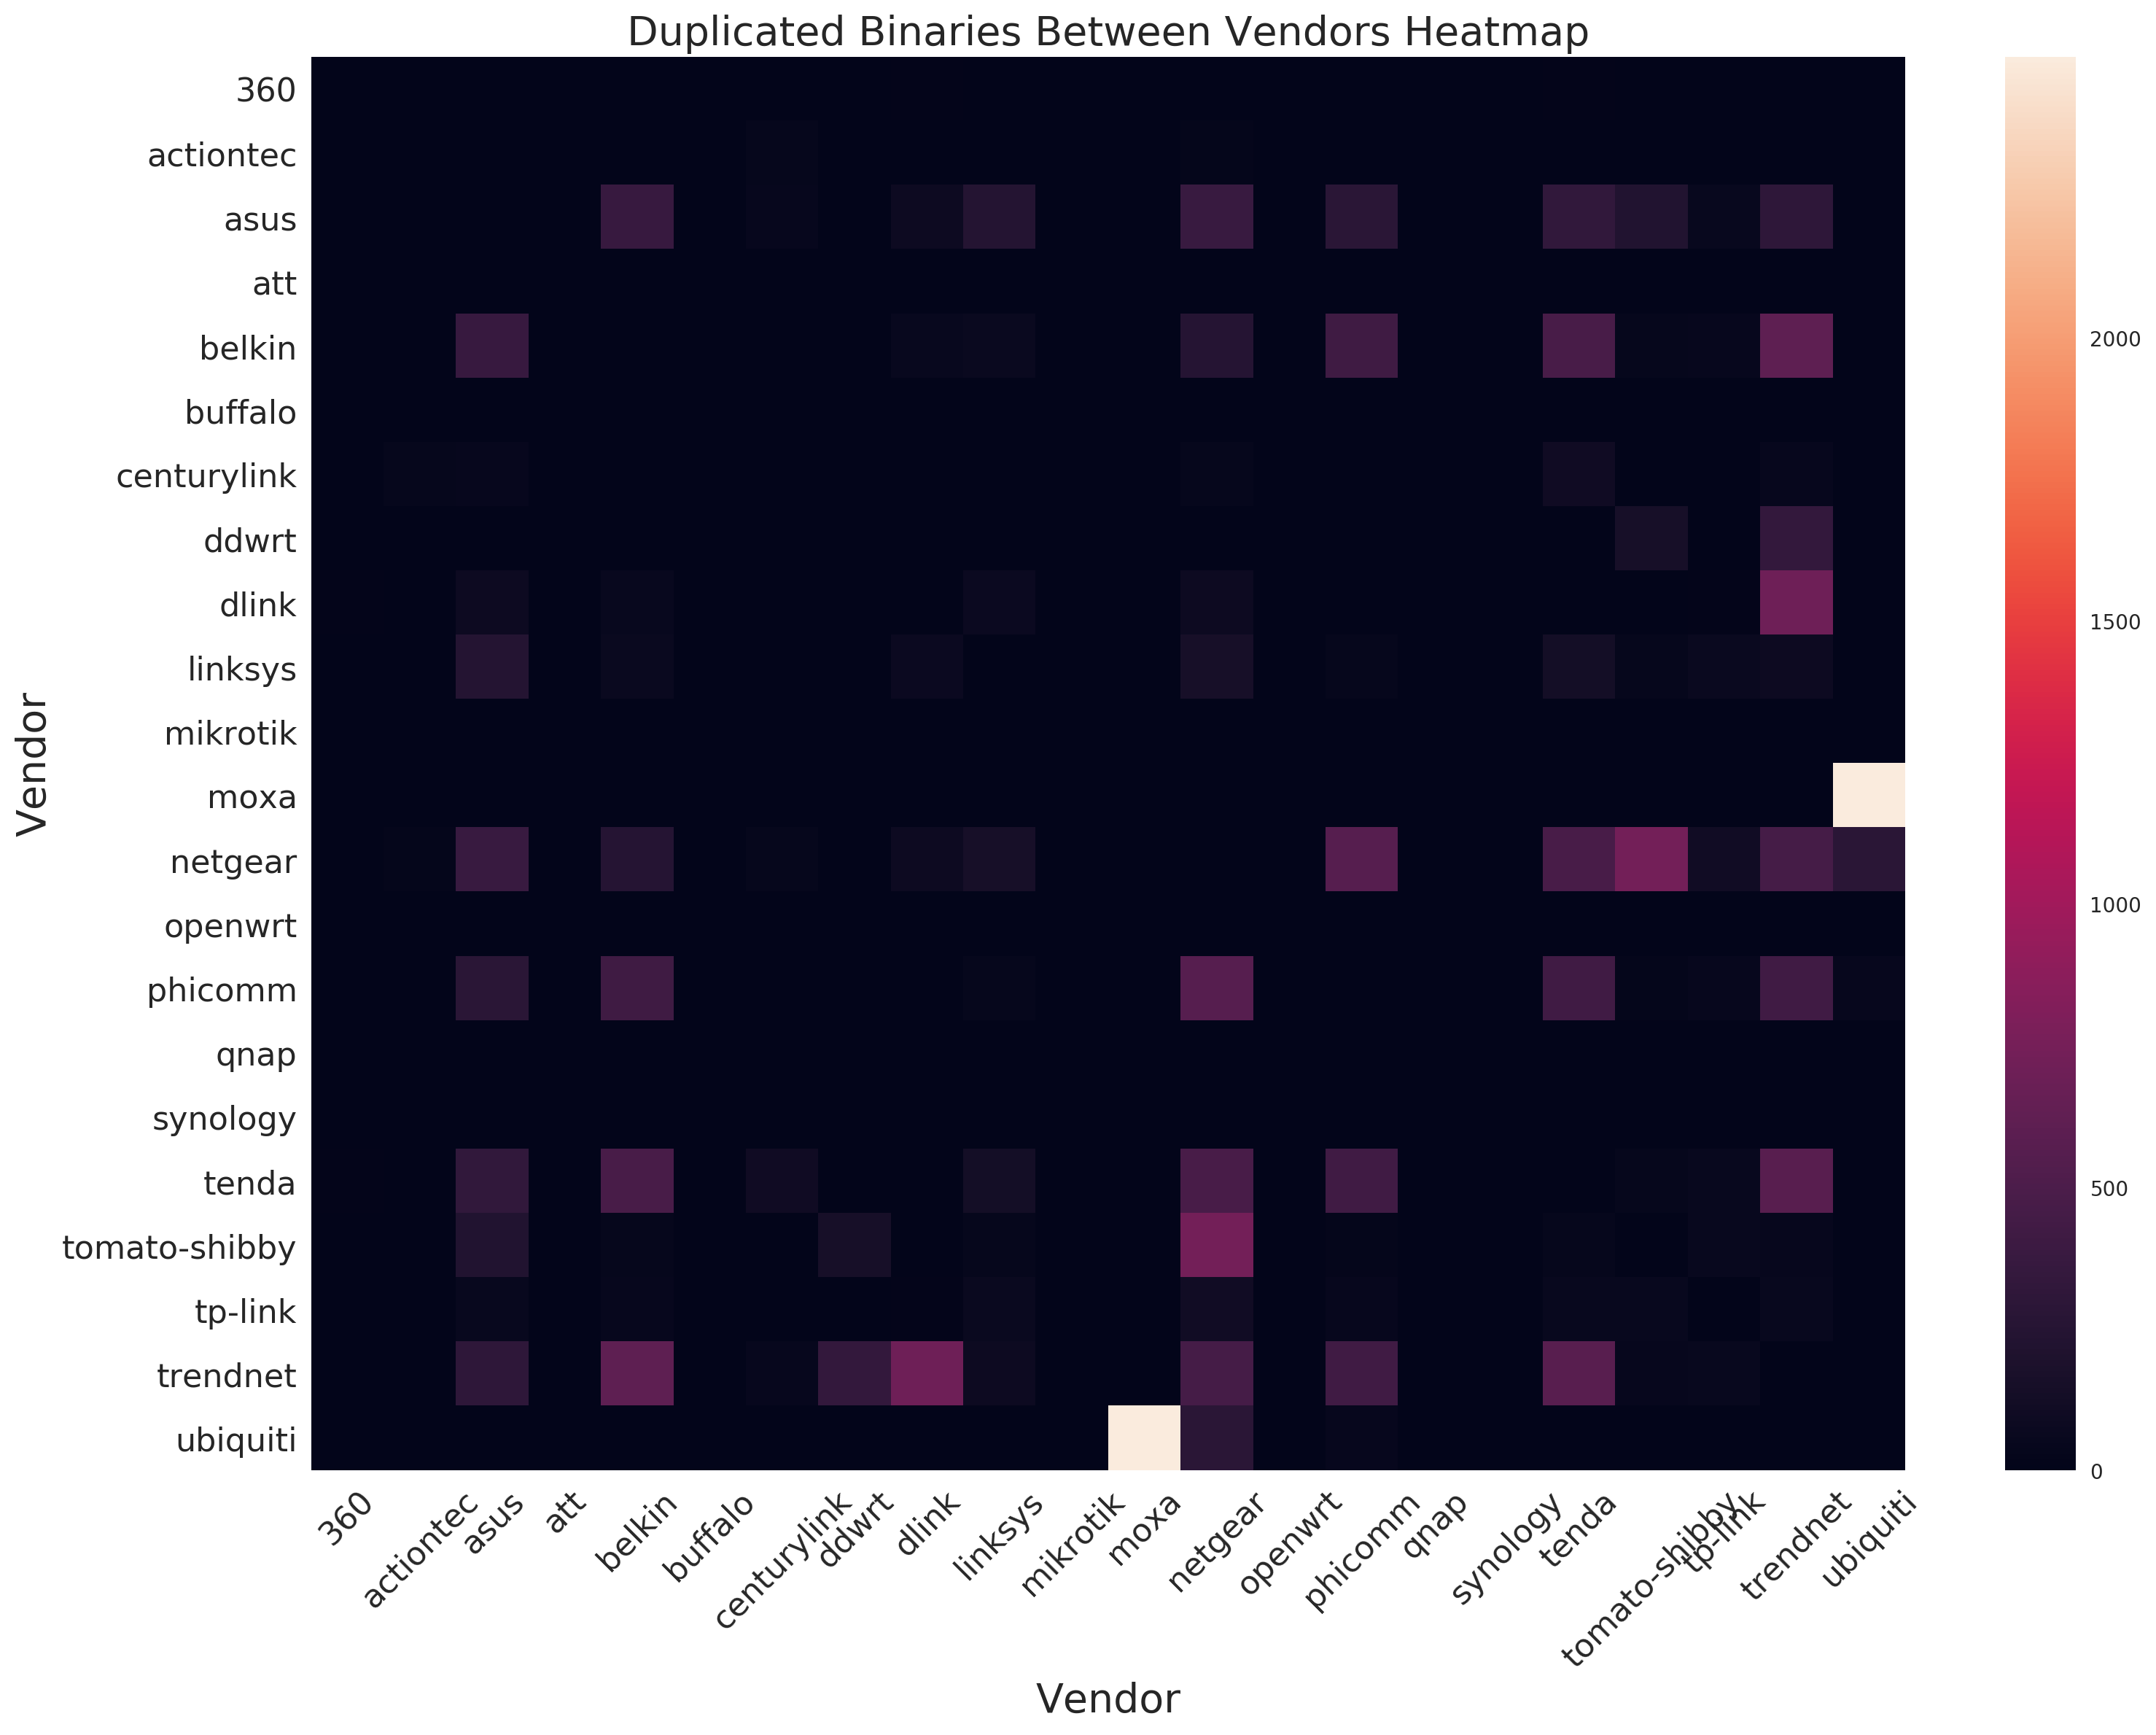
Surprisingly, we found that 3,704 binaries were duplicated between at least two vendors. Some binaries were found in 9 different vendors.
Duplication between products was also very common; some binaries were duplicated between 109 different products.
Why Is This Happening?
When manually exploring some of the binaries, one of the binaries duplicated across the largest number of different products was found to be built by Buildroot, an open source Linux userspace generation framework. We posit that the use of frameworks like this explains the appearance of identical binaries between vendors.
Regardless the cause, the fact that there is a large number of duplicated binaries presents both a problem and a solution.
The problem: these duplicated binaries present a lucrative target for attackers. A vulnerability in one of the more common binaries could be exploited across large number of vendors and products.
The solution: the fact that so many of the products share a common source and/or build system means that improving hardening could have a outsized impact. For example, in the case of Buildroot, adding binary hardening could impact a large portion of the IoT industry.
Conclusions
Our research paints a grim picture of binary hardening in the IoT ecosystem.
Vendors are failing to implement basic hardening features, including decades-old best practices.
Even more concerning is the obvious lack of testing for these features. If a vendor is able to remove most of the exploit mitigation from their product line, it undermines the value of asking customers to apply software updates.
Luckily, we think one of the most important takeaways is that there are low-effort paths that can be taken to improve the situation.
Many of these devices are low cost/high volume. They are given the minimal amount of development time to get a new product out the door. This means that security likely finds itself low on the list of priorities.
In the case of home routers and IoT devices, these devices sit in a location of privilege within the users’ home networks. Regardless of whether or not the device’s owner is an intended target, as “set it and forget it” appliances, these devices are an ideal hiding spot for botnets and other attacker-infrastructure. In short, it is a Good Idea for these devices to be reasonably secure.
Unfortunately, if the trend of minimal hardening does not change, these devices will continue to be a soft target for these types of activity.
That said, we conclude with two points which make us optimistic about the future.
- More data and insight on these devices will hopefully drive behavior changes within the vendors.
- The prevalence of duplicate binaries indicates that it might be possible to fix some issues at a single point. In the case of Buildroot, this can even be done by the community through pull requests.
The Data
One of CITL’s goals has been to distribute data to researchers and the wider community. Linked below is a CSV of all data we used for this research.
This dataset contains products such as home routers, enterprise equipment, smart cameras, security devices, and more. It represents a wide range of either found in the home, enterprise or government deployments.
About the Data
Below is a list of columns, their meaning, and possible data types.
Some columns optionally have numpy.NaN values. Hardening features are normally expressed as either an integer or a NaN value.
NaN values occur when the given hardening feature isn’t generally applicable to the binary in question. This can occur, for instance, in the case of ELF libaries (.so files), where the ASLR column is NaN because ELF libraries are always relocatable (and thus there is no way for them to not support ASLR).
We invite anyone with questions to reach out to us online.
| Column Name | Data Type | Meaning |
|---|---|---|
| sha_hash | str | SHA-256 of input binary |
| filetype | str | File type of the binary: (ELF/PE/MachO) |
| architecture | str | CPU Architecture of the binary: (x86/mips/arm/..) |
| bitness | int | CPU bitness of the binary: (32/64) |
| vendor | str | Vendor name |
| product | str | Product name |
| input_file | str | Binary path within firmware rootfs |
| release_date | str | datetime timestamp (Can be None) |
| firmware_version | str | firmware version |
| norm_score | int | normalized CITL score, range 0 - 100 |
| text_size | int | size of text segment in bytes |
| data_size | int | size of data segment in bytes |
| functions | int | count of functions within analysis CFG |
| blocks | int | count of basic block within analysis CFG |
| is_driver | bool | Is the binary a kernel module |
| is_library | bool | Is the binary a library |
| aslr | int + NaN | Does the binary enable ASLR: NaN (not applicable), 0, 1 |
| non-exec-stack | int + NaN | Does the binary have a non-exec stack: 0, 1 |
| stack_guards | int + NaN | Does the binary enable stack guards: NaN (not applicable), 0, 1 |
| fortify | int + NaN | Does the binary enable fortify source: NAN = None, UNKNOWN_FORT = 0, NOT_FORT = 1, MIXED_FORT = 2, FULL_FORT = 3 |
| relro | int + NaN | Does the binary enable RELRO: NAN = None, NONE = 0, PARTIAL = 1, FULL = 2 |
| seh | int + NaN | Does the binary enable Windows SEH: NaN (not applicable), 0, 1 |
| cfi | int + NaN | Does the binary enable Windows CFI: NaN (not applicable), 0, 1 |
| heap | int + NaN | Does the binary enable the MacOs HEAP protection: NaN (not applicable), 0, 1 |
| extern_funcs_calls | int | Count of external function calls (library calls) within the CFG |
| libs | list | List of linked library |
| good | dict | Dictionary of ‘good’ functions with call counts from CFG: {“my_func”: 2} |
| bad | dict | Dictionary of ‘bad’ functions with call counts from CFG: {“my_func”: 2} |
| risky | dict | Dictionary of ‘risky’ functions with call counts from CFG: {“my_func”: 2} |
| ick | dict | Dictionary of ‘ick’ functions with call counts from CFG: {“my_func”: 2} |